A good starting point for evaluating channel performance is by comparing the conversion rate metric of different traffic sources. But where to find this metric in GA4?
For quite some time it was not possible to see and analyze performance based on these type of metrics in the GA4 UI.
Thankfully, conversion rate metrics are now available in Google Analytics 4, but based on my experience not everybody knows how to access and leverage them.
 In this blogpost we will dive deep into the conversion rate and GA4 and how to leverage related metrics in various ways.
Table of Contents
- Conversions in GA4
- Conversion Rate in GA4
- Session vs. User Level CR%
- Conversion Rate and Standard Reports
- Conversion Rate and Explorations
- Conversion Rate and Specific Events
- Conversion Rate Summary Cards
- Concluding Thoughts
There is a lot to cover, let’s dive right in!
Conversions in GA4
A conversion is an important action that a user completes on your website or app. In 2014 I already wrote about the importance of setting macro and micro goals.
For Ecommerce websites, the primary goal or conversion is a sale, aka ‘purchase’ event in GA4. Google marks this event automatically as a conversion.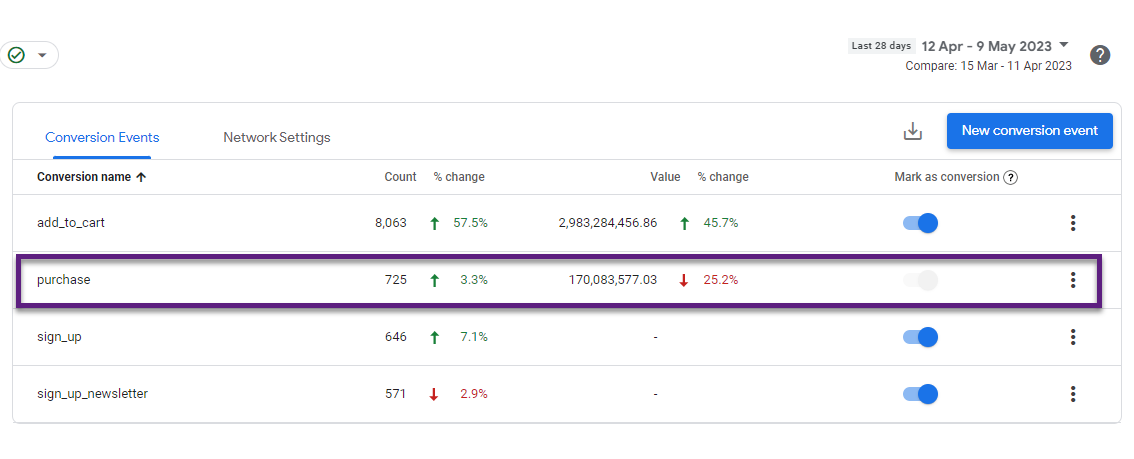 In addition, there can be many more relevant events to track as a conversion.
- Submission of a (lead) form
- Account sign up
- Webinar sign up
- Newsletter sign up
- Add to cart action
This is just a starting point; think about your business and (user) goals when setting up conversions in GA4.
Main point here is that having a purchase conversion or setting up other / additional conversions is a prerequisite for working with conversion rate metrics.
“Conversion rate optimization (CRO) is the practice of increasing the percentage of users who perform a desired action on a website. Desired actions can include purchasing a product, clicking ‘add to cart’, signing up for a service, filling out a form, or clicking on a link.”
Conversion Rate in GA4
In Universal Analytics the conversion rate was measured at the session level: (number of conversions) / (number of sessions) x 100%.
You had the option to create a calculate metric at the user level and integrate the user conversion rate in a custom report (or do an analysis outside of the reporting UI).
Based on scope, Google Analytics 4 allows you to analyze two different conversion rates:
- Session conversion rate
- User conversion rate
This can be very helpful as analyzing not one, but both metrics gives a much better indication of performance.
Session vs. User Level CR%
Session or user level CR%, which one is better? Well, it depends!
The user conversion rate is the percentage of users that successfully performed a specific action. Whereas the session conversion rate refers to the percentage of sessions in which any conversion event (or a specific one) took place.
Personally, I think combining insights from both metrics is most powerful for better understanding your audience, traffic sources and conversion actions.
Also, the type of report or analysis where you include one or both metrics is crucial. For example, it makes sense to include a session conversion rate metric if all the other metrics and dimensions primarily relate to session level performance.
Important note: the session conversion rate won’t match if you divide the number of conversions by sessions. This is because of how both metrics are calculated.
- The number of ‘Conversions’ accounts for all conversions
- The conversion rate formula is based on the number of sessions with conversions
For example, a user has triggered four conversion events in one session. This will be counted as four conversions, but it will only be a single converted session (aka session with conversion). This means that the more different conversions you define, the greater the ‘discrepancy’ might be in this report.
Conversion Rate and Standard Reports
On default, the conversion rate is not available in standard reports in Google Analytics 4. Happily, you can customize the reports and add additional metrics.
Here is how to add it to a standard report, i.e. ‘Traffic acquisition’.
Step 1: navigate to ‘Traffic acquisition’ within the reporting UI.
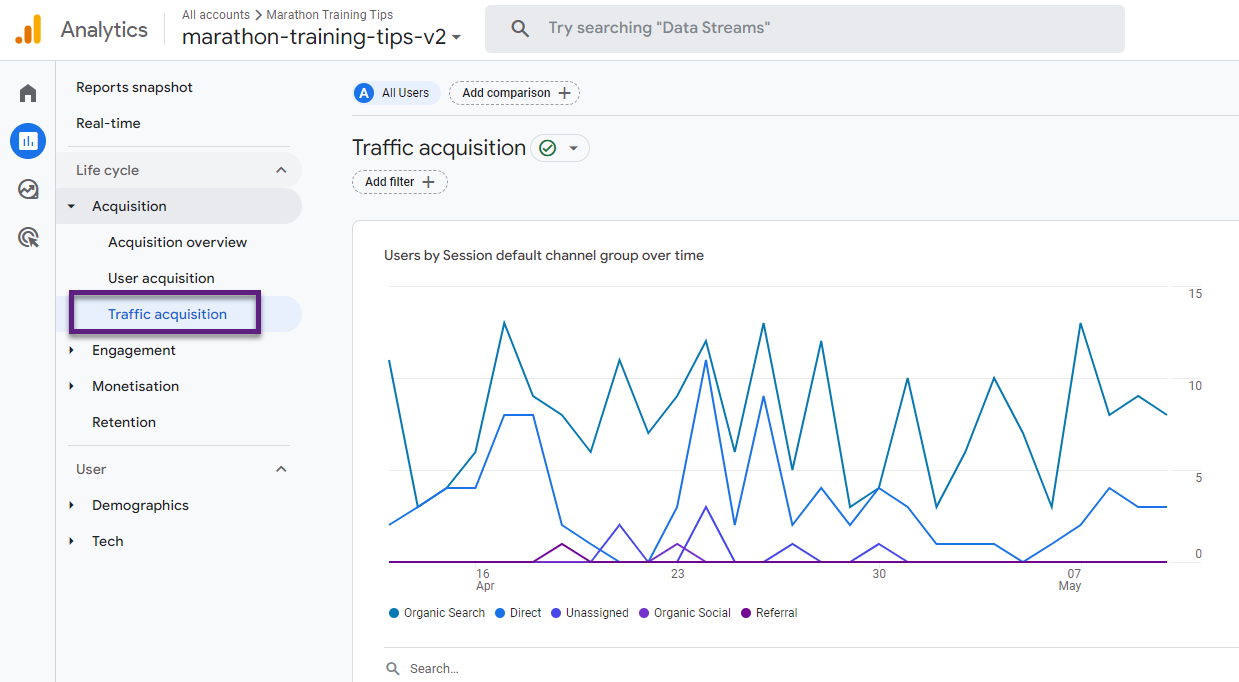
Note: I recommend minimizing the navigation bar to have a better view on the data that is reported.
Step 2: click on ‘Customize report’ in the top right corner.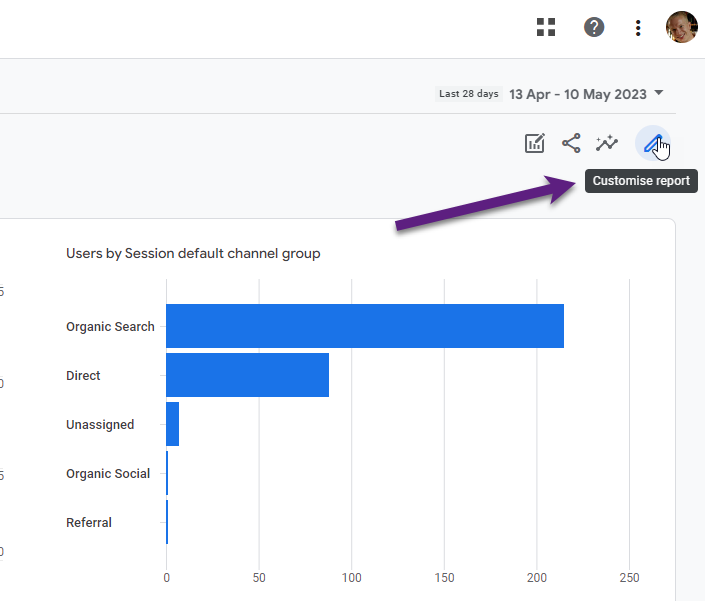 Step 3: click on ‘Metrics’ under report data.
Step 4: click on ‘Add metric’ link.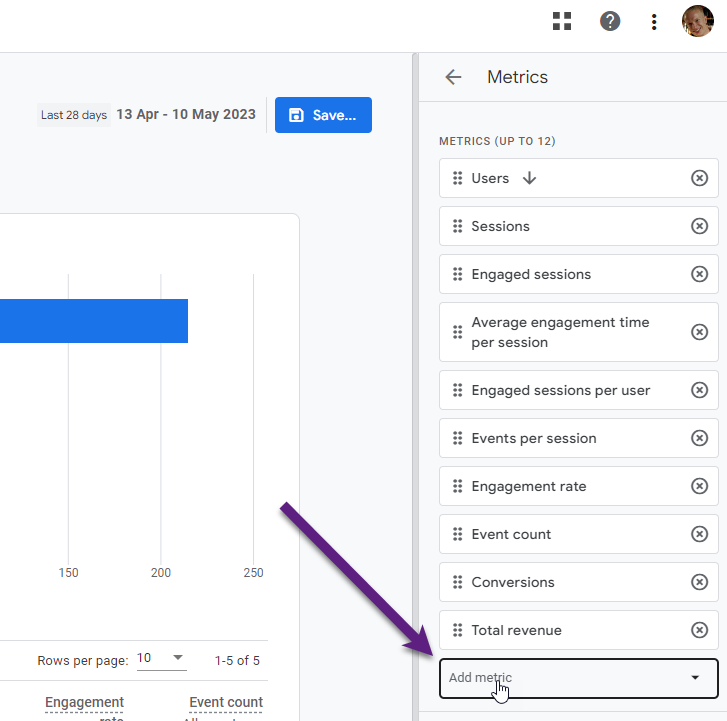
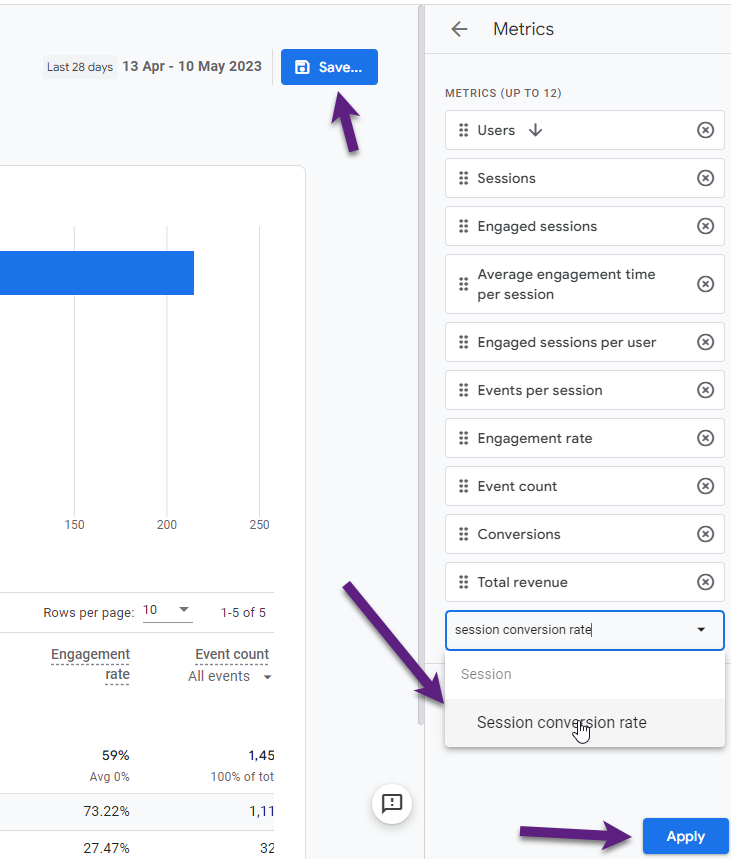
Step 5: search for and add ‘Session conversion rate’; click on Save.
Step 6: save changes to current report.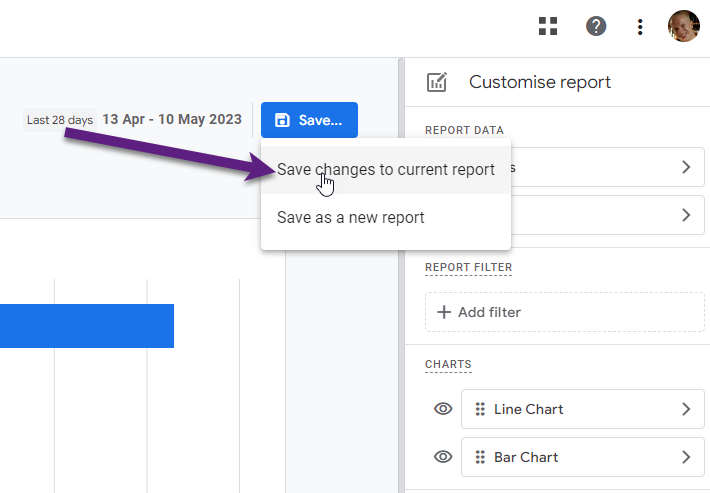
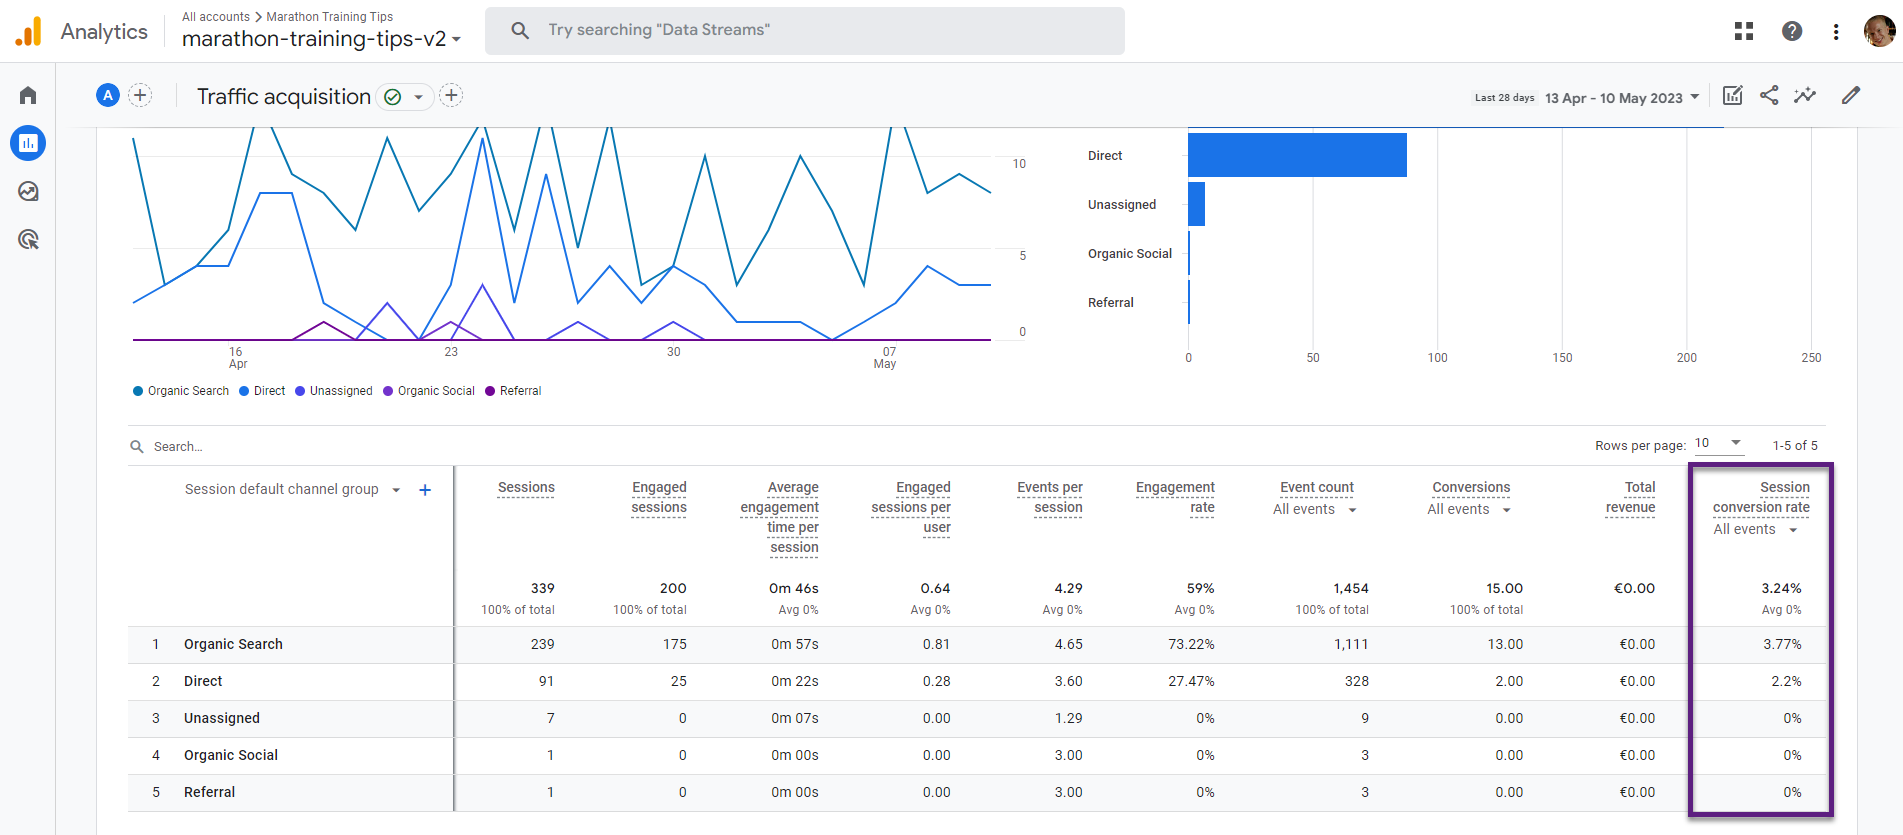
Step 7: review the new metric in your report.
 Good to know:
- Edit or administrator access is required for making these changes.
- You need to add this metric to every report where you want it to appear.
- You can change the order of the metrics; i.e. you can list it next to the ‘Conversions’ metric.
- In addition, the ‘user conversion rate’ metric is also available for you to include in a report of your choice.
Conversion Rate and Explorations
In addition to the standard reports, you can also include conversion rate metrics in Explorations.
I will use the Google Demo account for this example.
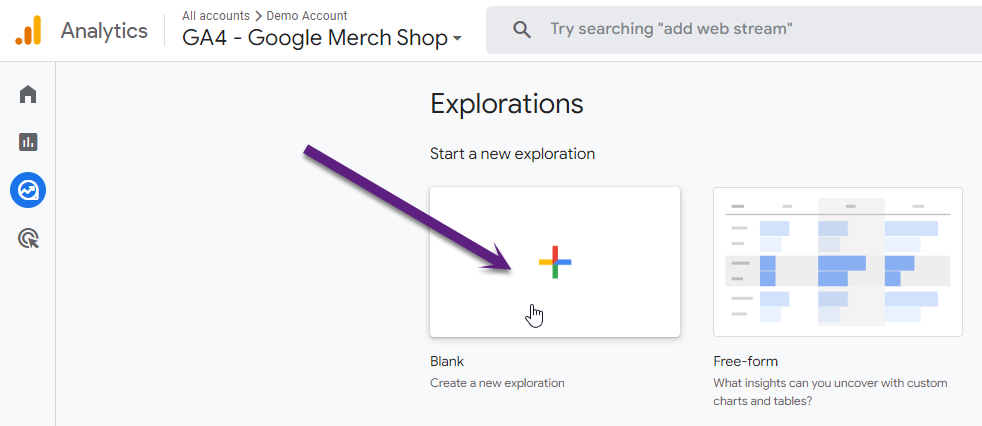
Step 1: navigate to the Explore section and create a blank report.
Step 2: add a name and select the metrics and dimensions to include in the report.
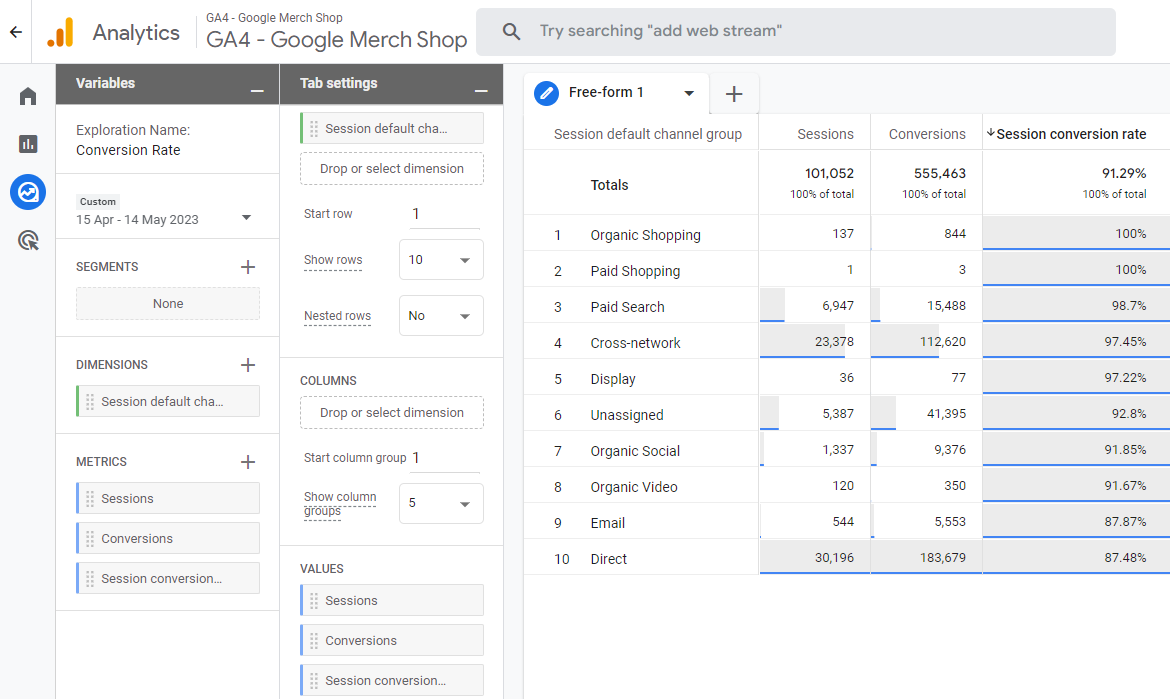
- Dimensions: Session default channel group.
- Metrics: Sessions, Conversions, Session conversion rate.
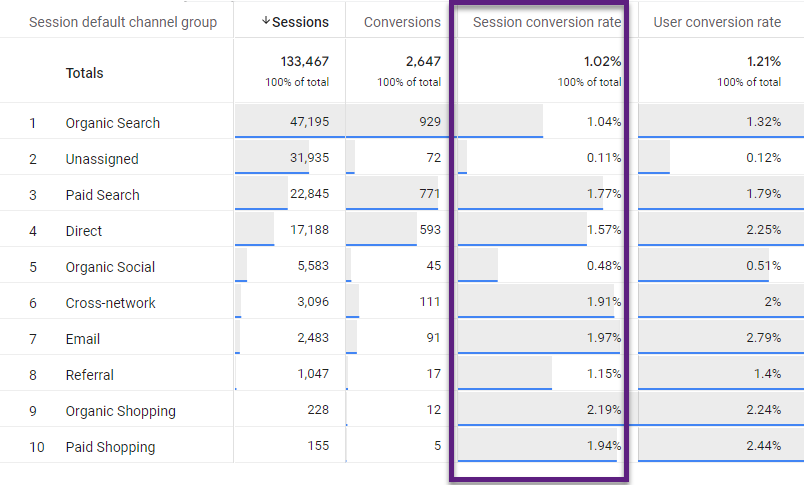
In this example I have only included ‘Session Conversion Rate’. You can review session and user-level performance side-by-side by additionally including user-level metrics and dimensions.
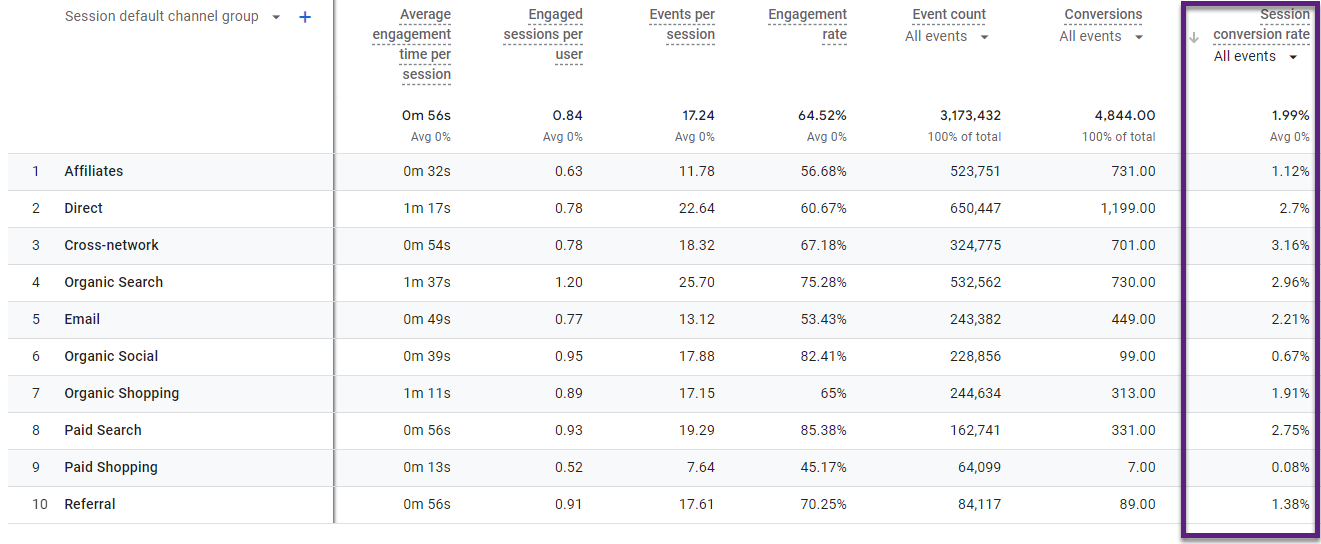
Step 3: review the report in all detail.
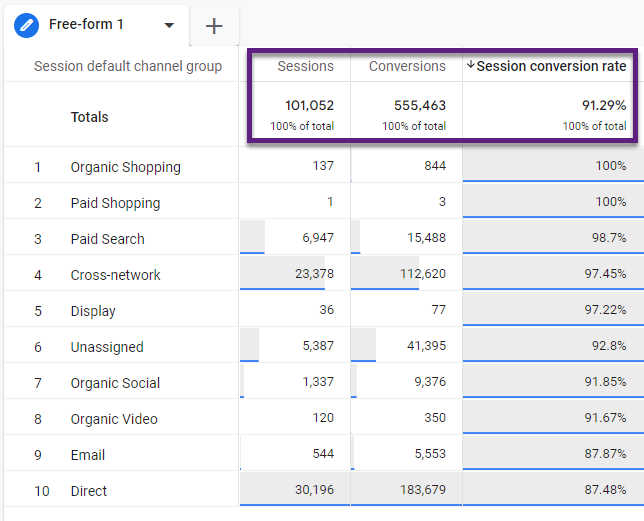
- Session conversion rate can be between 0 and 100% (aggregated and per dimension value, i.e. Organic Shopping).
- Session level conversion rate is 100% for a specific session if one or more conversions occur.
- Session level conversion rate on Google’s website is inflated due to the ‘page_view’ event defined as a conversion (below).
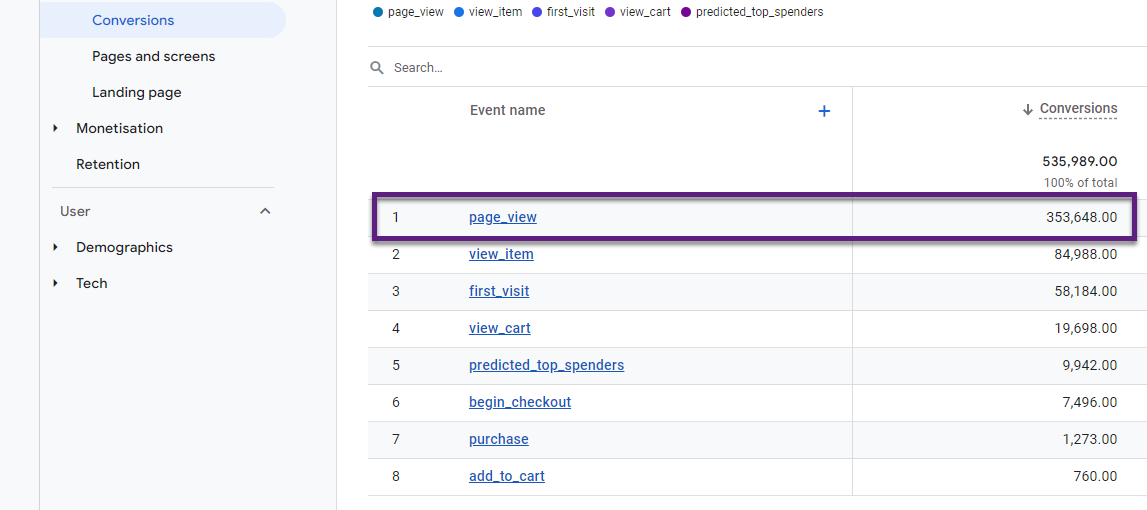
Defining a specific ‘page_view’ as a conversion is OK, but marking every ‘page_view’ event as a conversion will greatly skew your data.
Unfortunately, in Explore, there is no accurate way to narrow down the conversion rate to one specific conversion. However, this is possible in the standard GA4 reporting UI or when doing custom work outside the GA4 UI.
Conversion Rate and Specific Events
As mentioned, you cannot properly analyze the conversion rate of specific events in the Explore section.
Luckily, this is easy to do in the standard reports (after including the session and/or user conversion rate metric).
Step 1: open a standard report that includes a conversion rate metric.
Step 2: click on ‘All events’ and select the event of your choice.
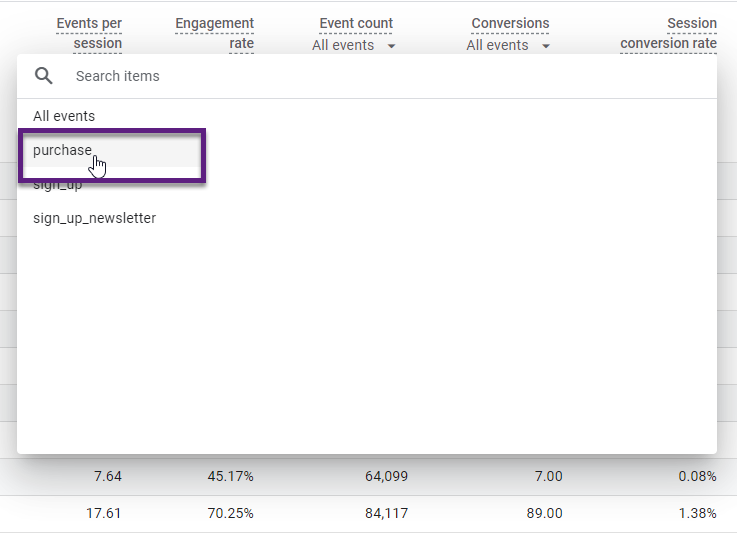
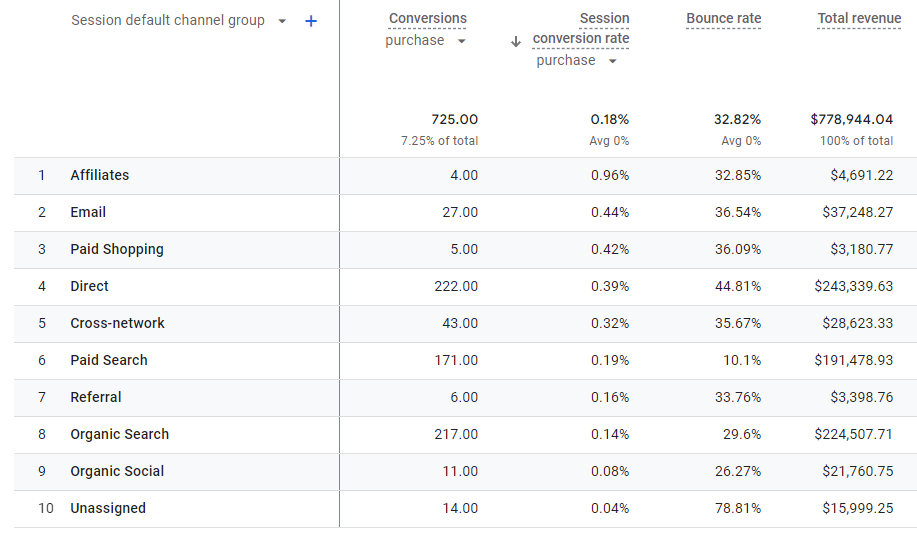
Step 3: sort channels on conversion rate ‘purchase’.
 This is a quick and easy way to review and analyze conversion data for one specific event. For better context, I recommend adding the same event under Conversions.
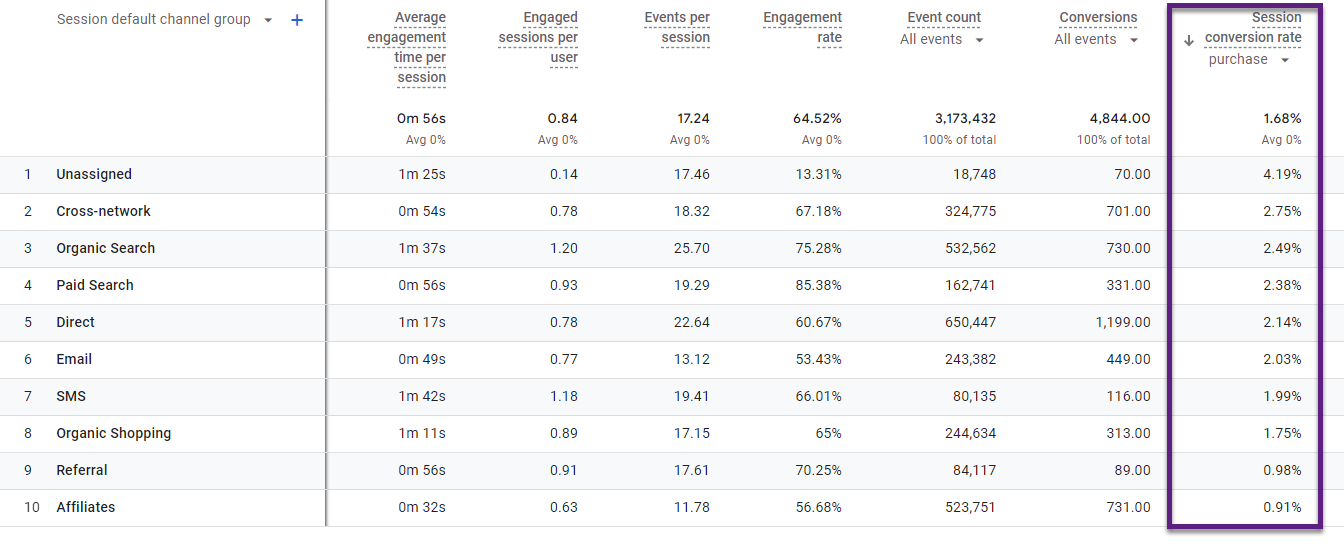
Step 4: select ‘purchase’ under Conversions.
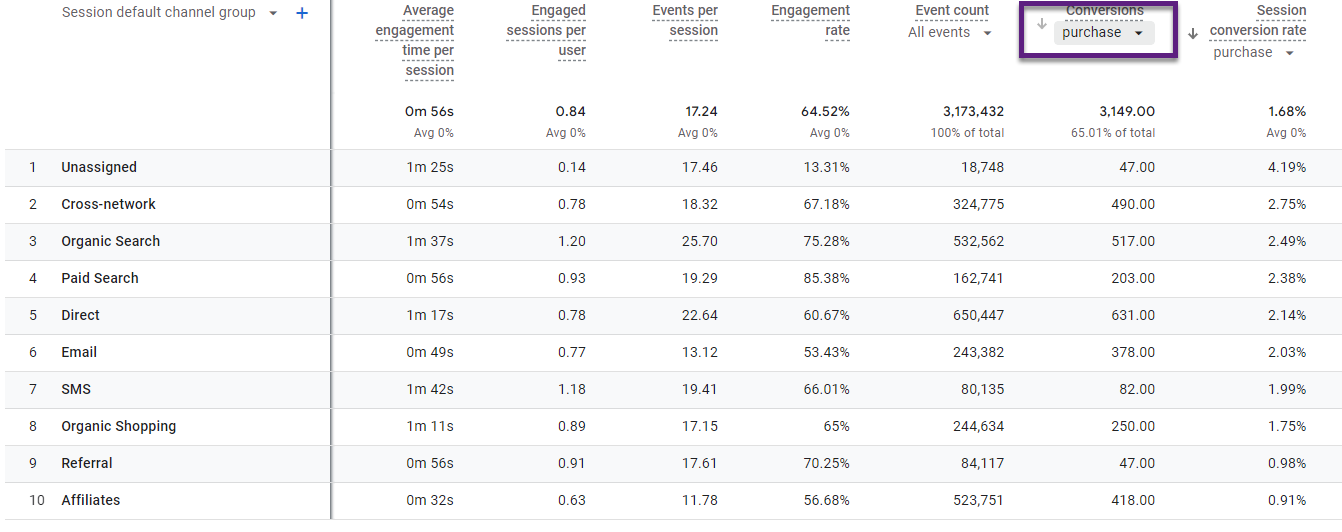 Your report is ready now! The conversion count provides more, relative context to the ‘session conversion rate’ per channel.
Conversion Rate Summary Cards
In my previous blogpost about custom channel groupings in GA4 you can find how to include a specific dimension or metric in a summary card (example #5).
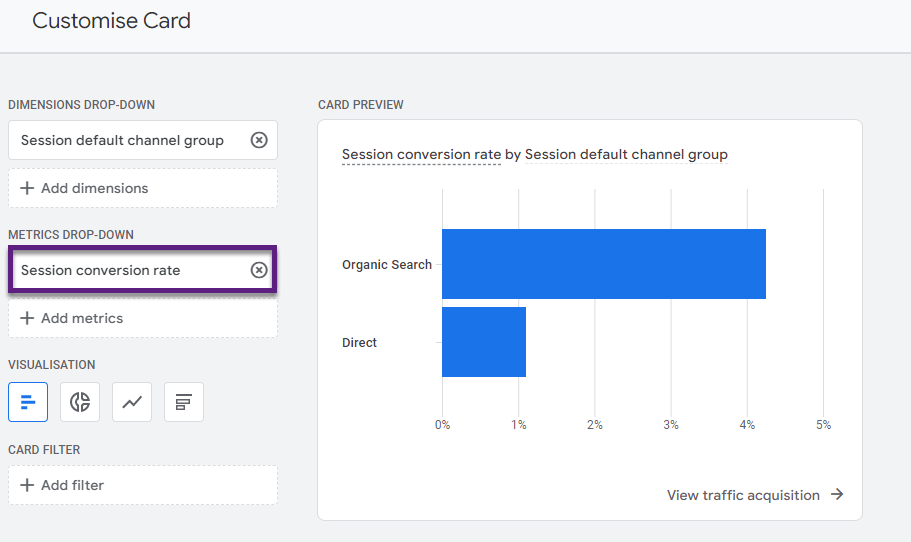
This is a very handy way if you want to include a conversion rate summary in certain report sections in GA4. For demonstrating purposes I have included this report card in the ‘Acquisition overview’ section.
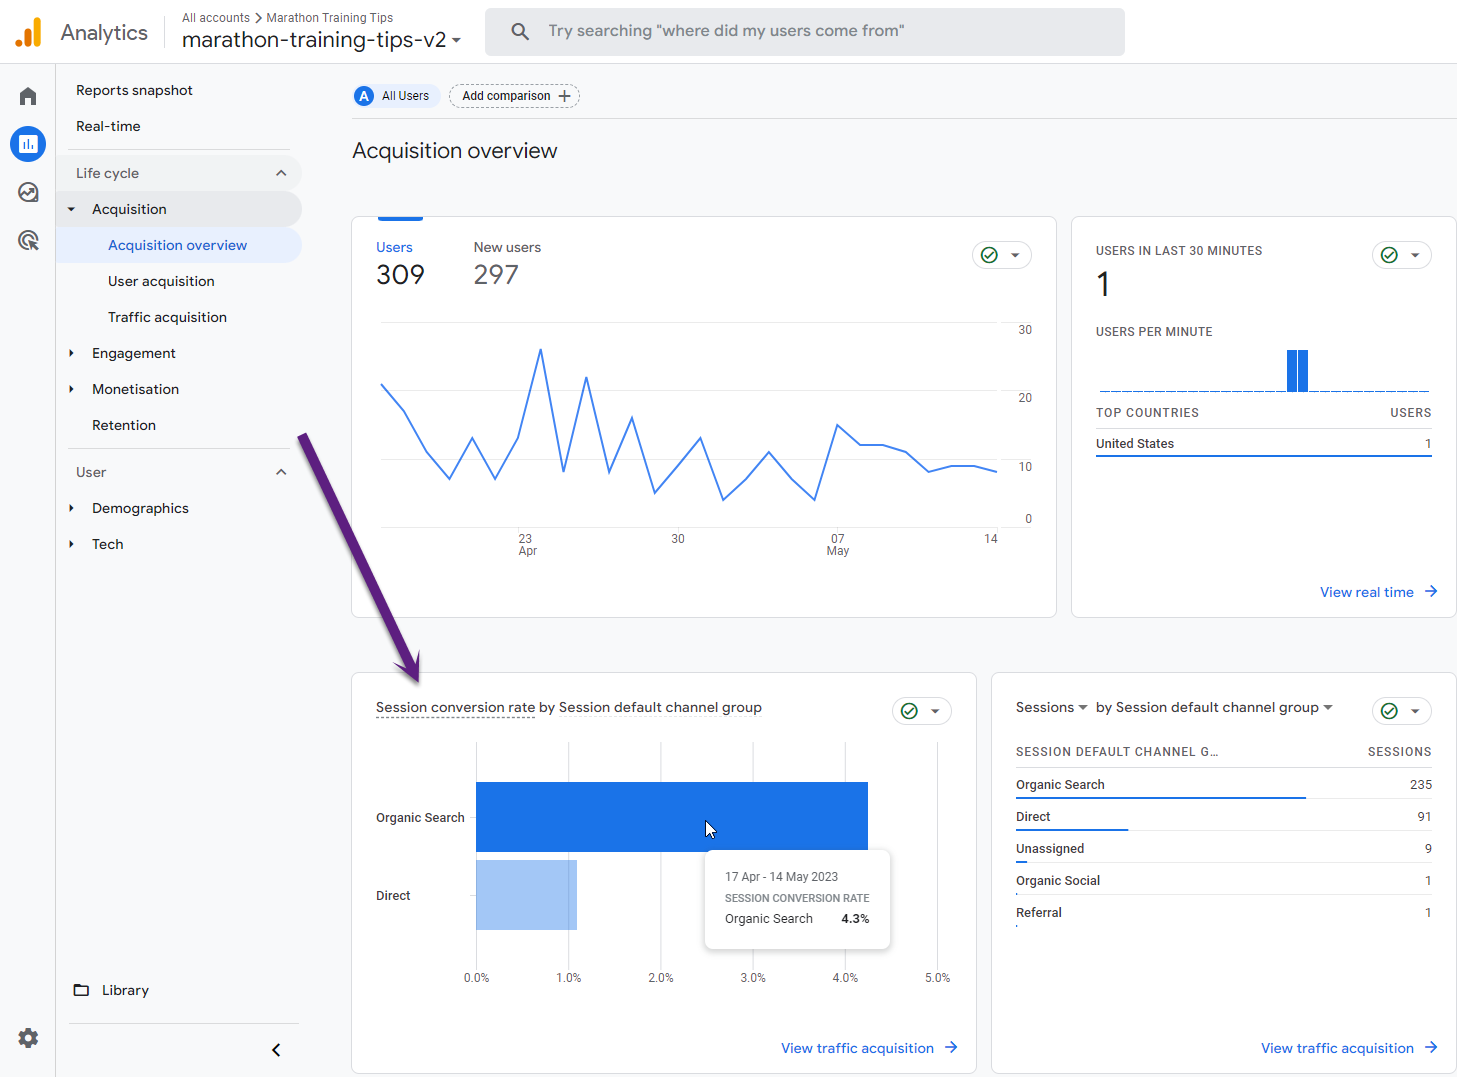
Here you go! You can customize GA4 and the reporting interface to your needs.
Concluding Thoughts
Not everything in GA4 is straightforward or logical.
- Why was conversion rate not available in the beginning?
- Why does Google not automatically integrate it in related standard reports once the metrics was (re)introduced?
Well, it is a fact that not all things go as expected. The great thing is that Google responds to users’ needs (to a certain extent at least).
This blogpost provides clear instructions on how to report on session and/or user level conversion rate within the GA4 UI.
Use this guide for integrating any other metric or dimension that is available, but not included by default.
This is it from my side, hopefully you’ve learned something new!
What is your experience with customizing reports in GA4 and changing the default setup? Do you have any tips to share? Thanks!
One last thing... Make sure to get my automated Google Analytics 4 Audit Tool. It contains 30 key health checks on the GA4 Setup.The post How to Analyze and Optimize on the Conversion Rate Metric in GA4 appeared first on Online Metrics.