Do you know exactly how each of your website sections perform? Content Groupings are very powerful in structuring and analyzing your content performance in a smarter way.
What business are you in? It might be a blog, leadgeneration or ecommerce site. Actually, it doesn’t matter.
Ccontent performance insights and optimization is crucial for every website.
On default Google Analytics shows you all the different pages that have received at least one pageview in the selected period.
For high traffic websites this report might look like this:
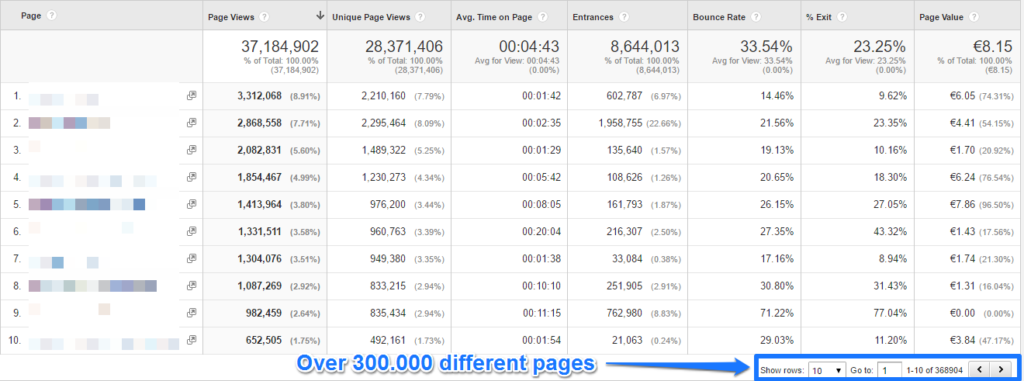
Over 300.000 pages, happy analyzing!
First of all, you need to use the right set of filters or adapt your view settings to remove all the “technical” query parameters in your default content report.
But this doesn’t solve everything.
A website that contains hundreds or maybe thousands or even more unique pages will greatly benefit from setting up content groupings in Google Analytics.
Ccontent groupings can actually be very useful even if you are just starting out with a new blog!
Table of Contents
- Definitions: Content Groupings and Content Groups
- Why to Use Content Groupings
- How to Set Up Content Groupings
- Settings of a Content Group
- Five Content Group Reports in Google Analytics
- Powerful Ways to Apply Content Groupings
- Eight Content Grouping Best Practices
Definitions
Before we go deeper into this material we need to cover the actual definitions first.
Currently you can create five content groupings in Google Analytics.
Within a grouping you can create multiple content groups.
A group is a collection of content. It could be pages in a certain section of your website or screens from a certain part of your app.
A grouping is just a bunch of groups.
Confusing right?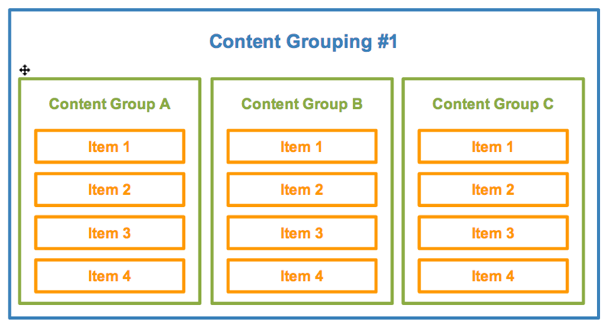
Why to Use Content Groupings
Let’s take a look at the definition of Google:
“Content Grouping lets you group content into a logical structure that reflects how you think about your site or app, and then view and compare aggregated metrics by group name in addition to being able to drill down to the individual URL, page title, or screen name.”
Collecting reliable data and structuring it in a proper way is very important if you want to turn your data into insights and eventually extra profits.
He is one the greatest mind in the Analytics field and emphasized once again that companies need to make better use of their current data instead of collecting more and more data.
And I fully agree here.
Use your current data in a smarter way before you move on to track all this fancy stuff (which you probably don’t use).
Content Grouping is a great example of how to better leverage your current data set.
How to Set Up Content Groupings
Google Analytics offers a couple of ways to set up your content groupings.
One way to do it is via the Google Analytics admin interface. However, it is also possible to set this up via Google Tag Manager.
Please note that content groupings are effective from the date of creation, not retroactively.
Via Google Analytics
In Google Analytics there are three different ways to set up content groupings.
First step is to navigate to the admin interface in Google Analytics and click on content groupings.
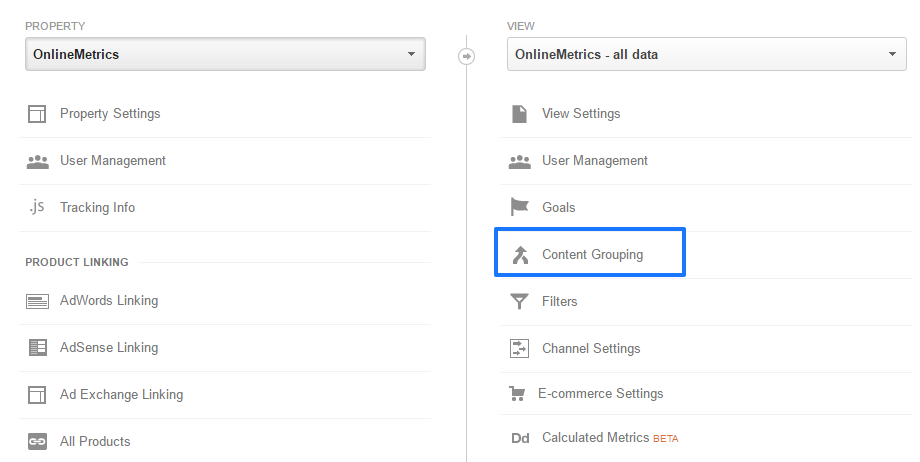 Currently you can create up to five content groupings. Within each of those, there is no limit to the number of content groups you can define.
There are three different ways to define content groups in Google Analytics.
1. Group by Tracking Code
The first option is to modify your JavaScript tracking code (good option if you have solid technical knowledge or work closely together with a webdeveloper).![]() You need to dynamically set this up for each of your website content sections that you want to separate from each other.
You need to dynamically set this up for each of your website content sections that you want to separate from each other.
It depends on your website architecture, but sometimes this is the only option to structure the content groups in your desired way.
2. Group using Extraction
Another option is to work with extractions. You can define your content groups by page or page title (websites) or screen name (apps).
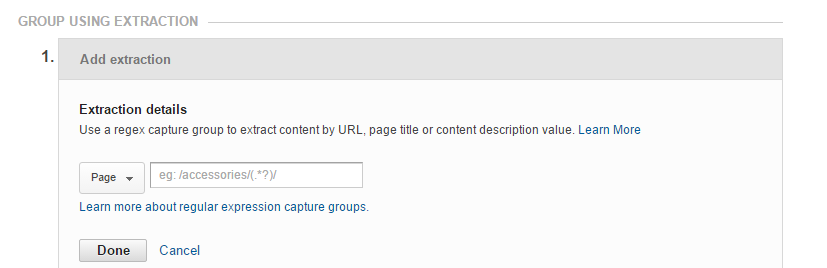 I recommend you to learn about regular expressions if you want to set it up via this method.
A SEO friendly website structure makes it more easy for you to define your content groups.
For example:
- /services/google-analytics-audit
- /services/google-analytics-coaching
- /services/google-analytics-implementation
In this case there is a logical naming structure that allows you to easier group these pages in one Services Content Group.
3. Group using Rule Definitions
I recommend to go for this option if you are not an advanced user of Google Analytics and want to create these content groups by yourself.
It is similar to option two, but more flexible to those who are not familiar with Regular Expressions.
And if you want to work with “negative” matches this grouping method is the way to go!
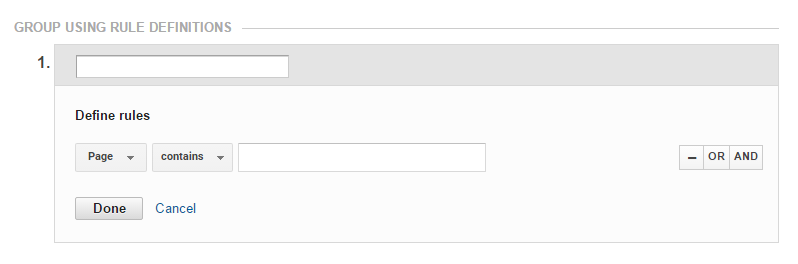 One again you can do the grouping by page or page title (websites) or screen name (apps).
In addition you can use statements as contains, starts with, ends with, but also does not contain, does not start with etc.
The negative statements can be very useful in my experience.
Sometimes you have defined all your content groups but a few pages are left. You can set up a match on does not contain your other pages and you are good to go!
Via Google Tag Manager
Julian Juenemann does a great job in explaining how to set this up via Google Tag Manager.
If you are familiar with Google Tag Manager and want to set it up via GTM I recommend to watch his video.
Settings of Content Grouping
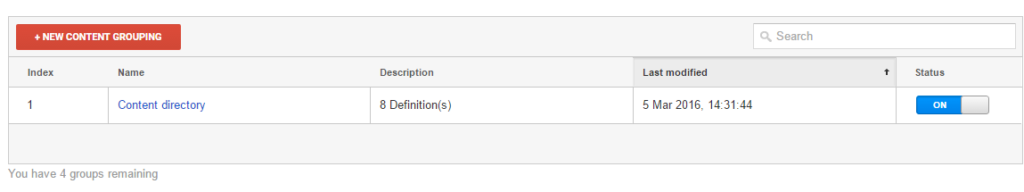
Here is an example of a content grouping I have set up for a well-known blogger.
 Content Group overview:
- Index 1 (four slots are still free)
- Name: Content directory
- 8 Definitions
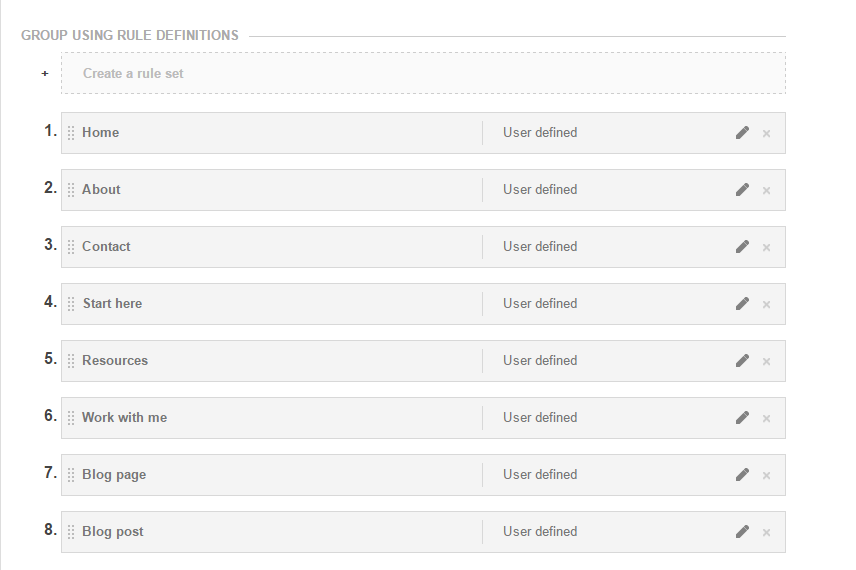 We defined the content groups in terms of website section.
- Home, About, Contact, Start here, Resources and Work with me are all one page sections.
- Blog page contains archive and author pages.
- Blog post is a collection of all blog posts.
It was easy to define group number one and two. Simply by matching the URL with the corresponding group.
However, if all blog posts reside in the root, it becomes more difficult to make a match.
That’s why I haved applied a “negative” match here.
This is how it looks: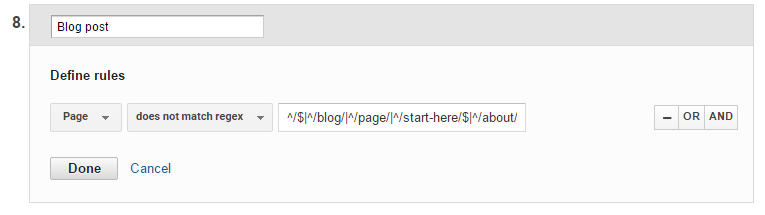 In this case I used a negative RegEx to extract the last content section.
Two more things:
- Use Excel and Google Analytics to sum up all pageviews in your content grouping. And compare it to your all content report pageviews in Google Analytics. A higher number of pageviews in Google Analytics will lead to a large (not set) content group in your content grouping. This is something to avoid!
- The rules get processed in the order of your group items. Number one is the first rule that is processed by Google Analytics.
Five Content Group Reports in Google Analytics
There are different reports in Google Analytics where you can access your content groupings.
All Pages
The All Pages report is a good place to start if you want to see which pages are popular on your website.
Step 1: Navigate to Behavior >> Site Content >> All Pages.
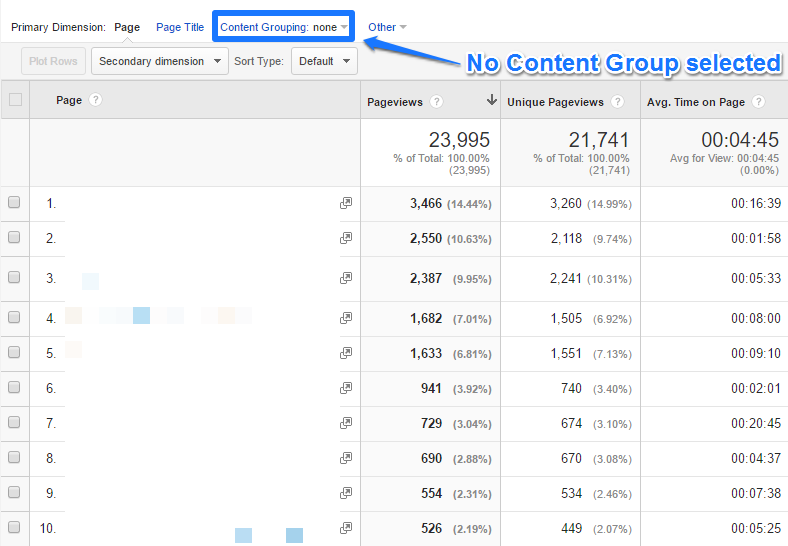 Step 2: Select your Content Grouping.
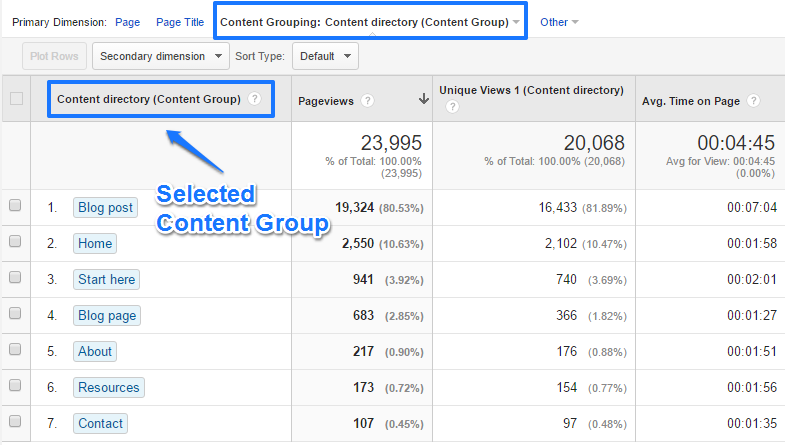 Now you have a more aggregated view on your content performance.
In this case 80% of the pageviews are on blog posts. People spend by far the most time in this section of the website.
Normally you would have to drill down or search to find more information on your contact or about page since they have a relative low volume of traffic.
It’s more easy to put things in perspective now.
Landing Pages
Another great report where you can examine your content performance is the Landing Pages report.
In my opinion this report is very valuable to any organization.
Step 1: Navigate to Behavior >> Site Content >> Landing Pages.
Step 2: Select your Landing Content Group.
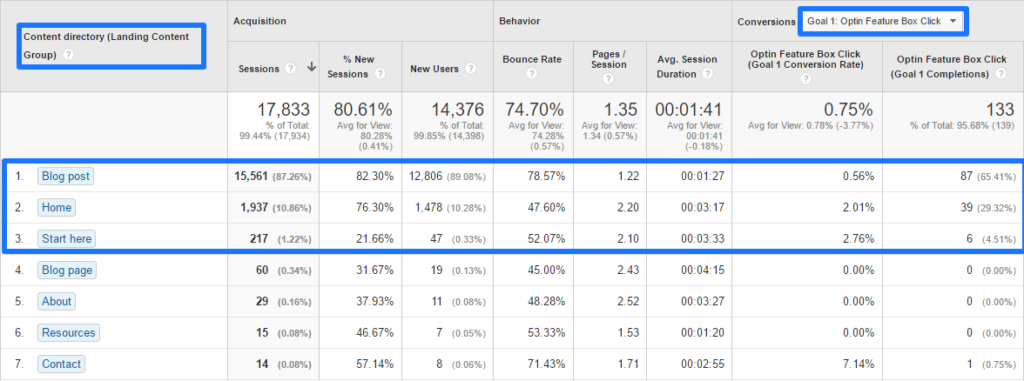 A few things to conclude here:
- The evaluated goal is on “Optin Feature Box Clicks”.
- Almost 90% of the traffic lands on a blog post.
- In absolute numbers, the blog posts are responsible for 2/3 of all conversions.
- The “homepage” and “start here” page convert really well.
- The “homepage” converts three times above average if compared to it’s traffic percentage.
In short, you can get a very quick overview of how your landing content groups actually perform.
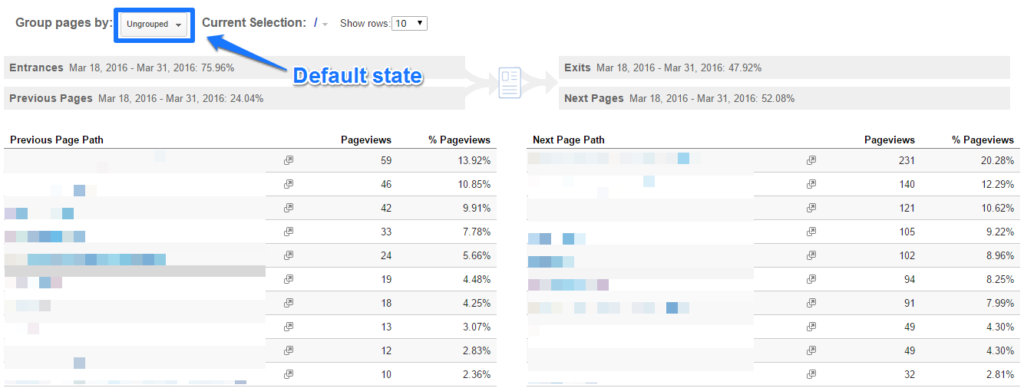
Navigation Summary
The Navigation Summary report can be hard to read if you have hundreds or maybe even thousands of pages on your website.
Applying content groupings can be really effective if you want to know how people navigate through different sections on your website.
On default the content is ungrouped in this report:
 There are two things you need to do to create a more accurate overview:
Step 1: Change Group pages by to the name of your content grouping.
Step 2: Change Current Selection to one of your content groups, e.g. Blog Post.
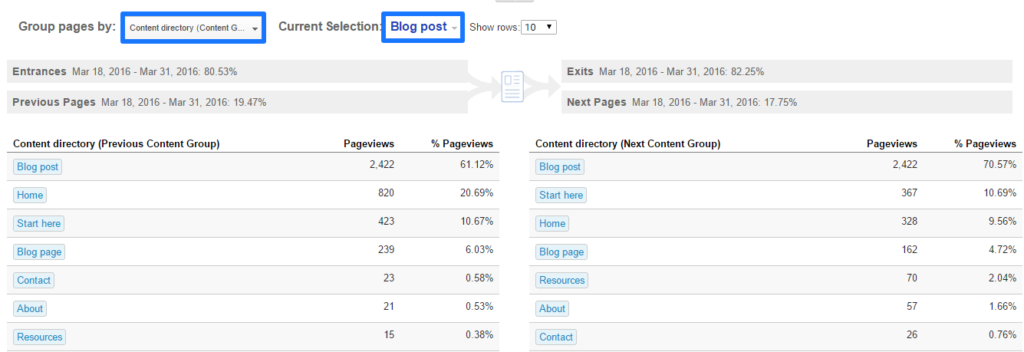 This is great information. A few insights on this blog:
- More than 80% of the visitors leave the website on a blog post.
- 7 out of 10 people that view another page go to a blog post.
- 10% continues to the “start here” or “home” page.
- The “resources” page, where a lot of affiliate links are embedded, gets 2% of all clicks of people that continue their journey.
These quick insights are impossible to get from the default settings.
This is another reason why you need to set up content groupings in Google Analytics.
Behavior Flow
The Behavior Flow report isn’t my number one report, but it can be useful in some cases.
It visualizes the path users take from one page or Event to the next.
This report can help you discover what content keeps users engaged with your site. It can also help identify potential content issues.
Navigate to Behavior >> Behavior Flow.
In my example below I followed these steps:
- Navigate to Behavior Flow.
- Select Content directory Content Grouping.
- Change the dimension to Default Channel Grouping.
- Select Organic Search.
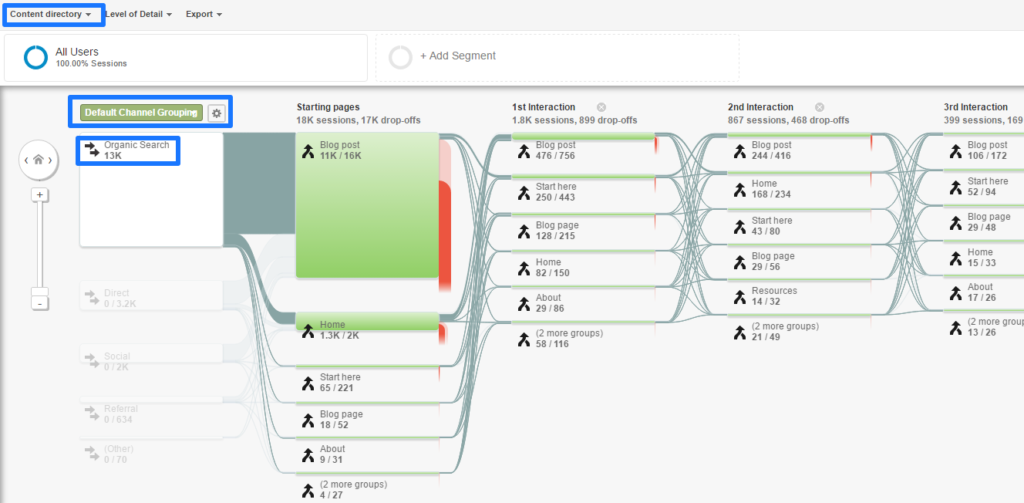 It helps me to analyze how people that come to my site via organic search navigate from one section to the other and where they drop off.
Event Pages
There is one last report I want to share with you. It’s the Event Pages report.
Most people view their events in relation to a particular page. However, it is also possible to view your events in relation to specific content sections on your website.
Here is how to do it:
- Navigate to Events >> Pages.
- Select a Content Grouping.
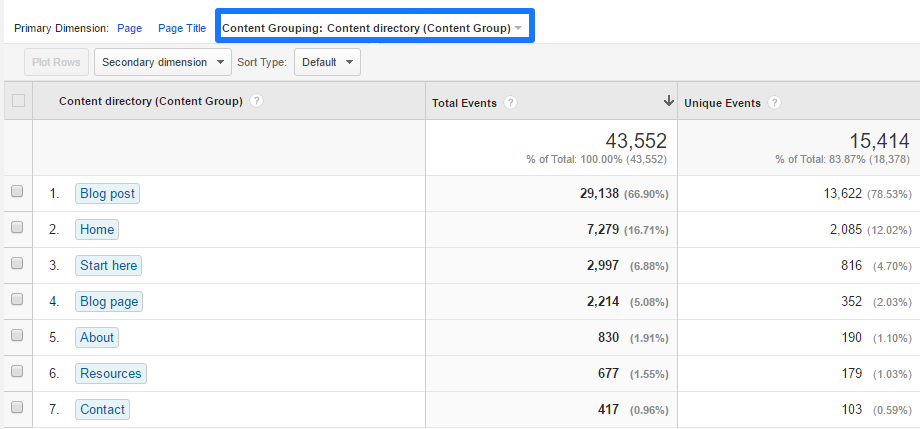 By using secondary dimensions and table filters you can further drill down on your event data to make it more actionable.
I hope these five examples awaken your creativity to work with Content Groupings in Google Analytics.
Powerful Ways to Apply Content Groupings
There are a few more ways to leverage content groupings in Google Analytics.
I like to share six more things you can do with them.
Secondary Dimensions
In the past I wrote an in-depth post on secondary dimensions.
It’s one of the powerful features in Google Analytics to segment your data.
Report example (content grouping as secondary dimension in Country report):

You can analyze and optimize different content clusters in relation to a few metrics and another dimension.
Custom Segments
Custom segments belong to my most used power features of Google Analytics.
I recommend to read this post first if you are new to segments in Google Analytics.
Let’s assume that you want to segment on all sessions where a blog post is visited:
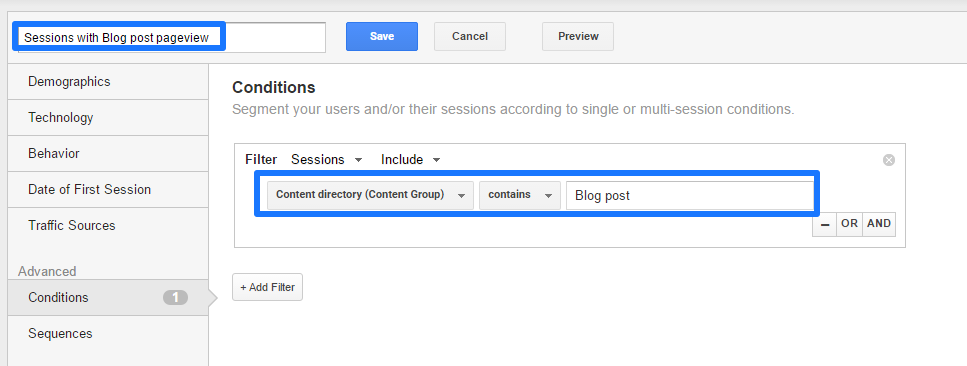 It’s far more easy to use the specific content section via a content grouping than to individually segment on all blog posts.
Custom Reports
As you might know, Custom reports can be really effectively in bringing together your most important metrics and dimensions.
And once again, your can leverage your content groupings here.
You could apply a content grouping or group as a dimension or use it as a filter in your report.
Custom Dashboards
Are you a fan of creating dashboards in Google Analytics?
You might want to check out content groupings and how to leverage them in your dashboards.
It’s a great addition if you want to share more about the content performance with your team.
Custom Tables
Customizing your data tables and drilling down on your data is a very effective strategy.
You can use content groupings as a table filter if you want to analyze the metrics for that specific dimension.
Core Reporting API
Last but not least, the core reporting API.
You can use the Google Analytics API to automatically export data related to content groupings.
Currently there are three dimensions and one metric directly available.
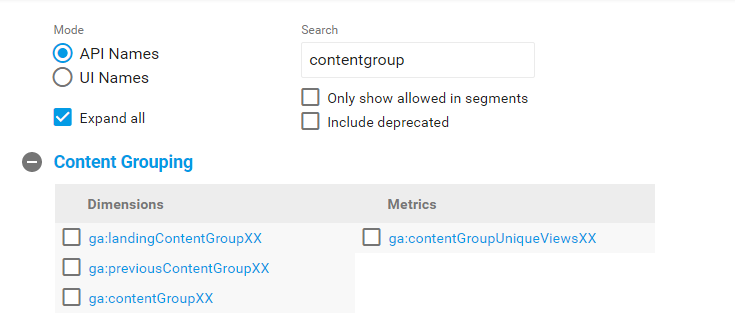 Here is a complete list of the metrics and dimensions in Analytics Reporting API v4.
Eight Content Grouping Best Practices
Make sure to apply the following seven best practices when working with content groupings:
- Start out with defining the objectives of setting up your content groups. On what level do you want to analyze and improve your content performance?
- Define the best method to set up your content groups.
- Set up goal values for each of your goals. This way you can get the most actionable insights from related reports.
- Keep content groups up to date to minimize (not set) as a content group.
- Create logical groups that reflect your different content templates and sections on your website.
- Create one group that involves all content sections at the overall (aggregated) level.
- Set up other groups (you can set up five groups per view) for a deeper analysis on subsections of your main website categories.
- Make sure to set them up in the right order. It’s the same as with filters, the order of the different rules matters to the outcome.
This is it from my side. Many companies don’t leverage content groupings at all and I like to see that change.
What is your experience with Content Grouping in Google Analytics? If you like this article, it would be great if you share it and leave a comment below!
One last thing... Make sure to get my extensive checklist for your Google Analytics setup. It contains 50+ crucial things to take into account when setting up Google Analytics.Download My Google Analytics Setup Cheat Sheet
The post The Complete Guide to Google Analytics Content Groupings appeared first on Online Metrics.