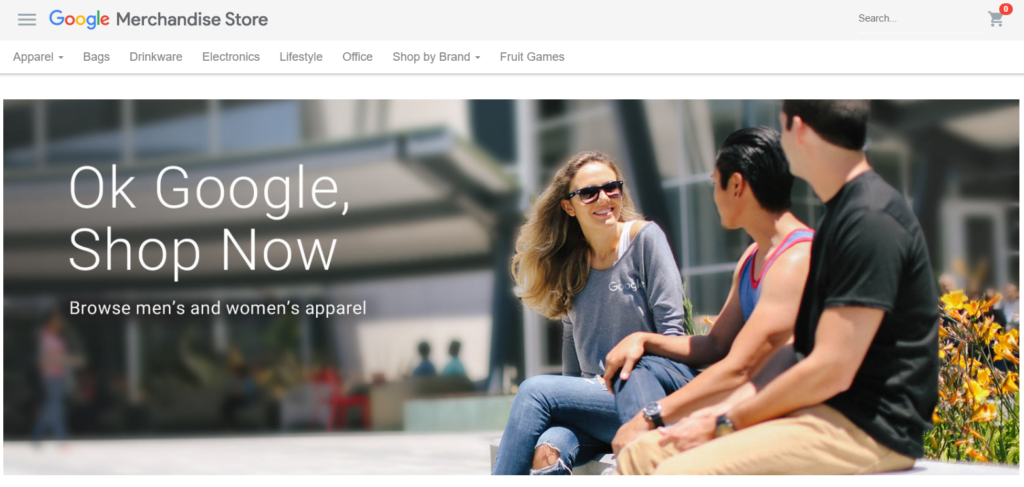
Nothing can beat learning from real-world Analytics data. Google has just opened the door to their ecommerce store data, a great opportunity for anybody who wants to accelerate their learning!
In the past I have written a lot about how to enhance your (Google) Analytics learning curve. And how to get free Google Analytics support.
One of my most important tips was launching a website, collecting data and using it to optimize the website outcome. For a lot of people easier said than done. Attracting a substantial amount of visitors in a short time isn’t that easy!
Now, the introduction of the Google Analytics Demo Account can take away all the pain of having to set everything up by yourself.
![Google Analytics Demo Account]() How to Access the GA Demo Account
How to Access the GA Demo Account
 How to Access the GA Demo Account
You can get access to the demo account in less than five minutes.
This support article describes the steps you need to take to get access.
A few things first:
- The data comes from Google Merchandise Store.
- The demo account is incredibly useful for exploring Google Analytics reports and features.
- You can easily remove yourself from the account (if desired).
- Your access level is limited to “read & analyze”. It simply means you can’t ruin their data. :-)
Get direct access to the GA Demo Account.
What You Can Learn from Google
Of course I have already spent some time to familiarize myself with their account. :-) This since I am curious about how they have done the setup, what the data looks like etc.
In the rest of this article I will share 25 important takeaways from their account setup and reporting environment. You will love it!
Note: if you are relatively new I recommend to check out this Google Analytics Account Setup article as well.
Administrator Section
I will start of exploring their account setup and what you can learn from them.
Maybe I will even reveal some improvement to their account; it’s never perfect! :-)
I always want to know a bit more about their setup before diving into any reports. You need to know how the data is gathered. Preferably I would also speak to the account owner first, but that’s something for another time.
1. Account Structure
This is an overview of their account structure: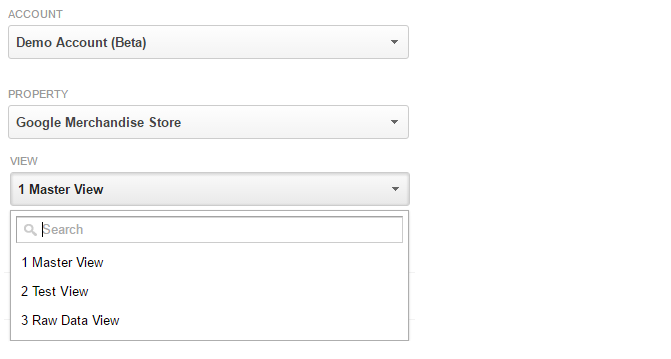 The Google Analytics demo account consists of:
- One property (Google Merchandise Store)
- Three different reporting views (Master, Test and Raw Data View)
This structure is exactly what I recommend using in workshops:
- Always set up a raw data view (security / backup view) for when something goes wrong.
- Testing view for testing new filters or other major setup changes that affect the data being collected.
- Master view where you apply specific filters and other modifications.
This is an example of a basic reporting view setup. You might want to set up a few more reporting views that suit your needs. Working with numbers (in this case: 1, 2, 3) is another best practice to make sure that the most used reporting view is shown on top.
2. Google Analytics Filters
We already shortly spoke about filters, but let’s take a closer look at the filters in the GA demo account.
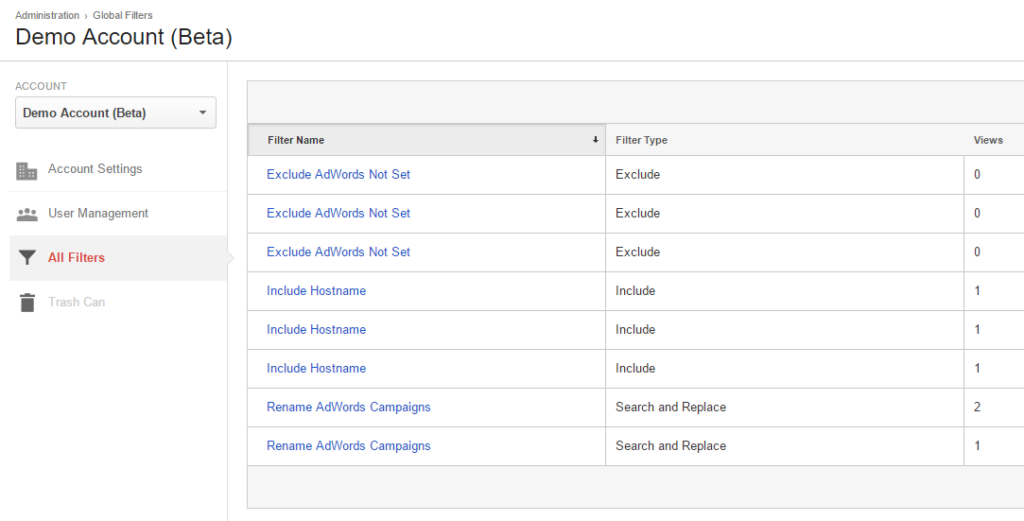
- They have only a few filters in use.
- It seems like there are a few duplicates.
- They have applied filters to the raw data view as well.
- IP address, lowercase and some other common filters are not set up.
To be honest, I had expected a more solid and comprehensive setup here, but these guys at Google are probably busy doing other stuff as well! :-)
3. Property Settings
Getting the property settings right is another thing you should pay attention to.
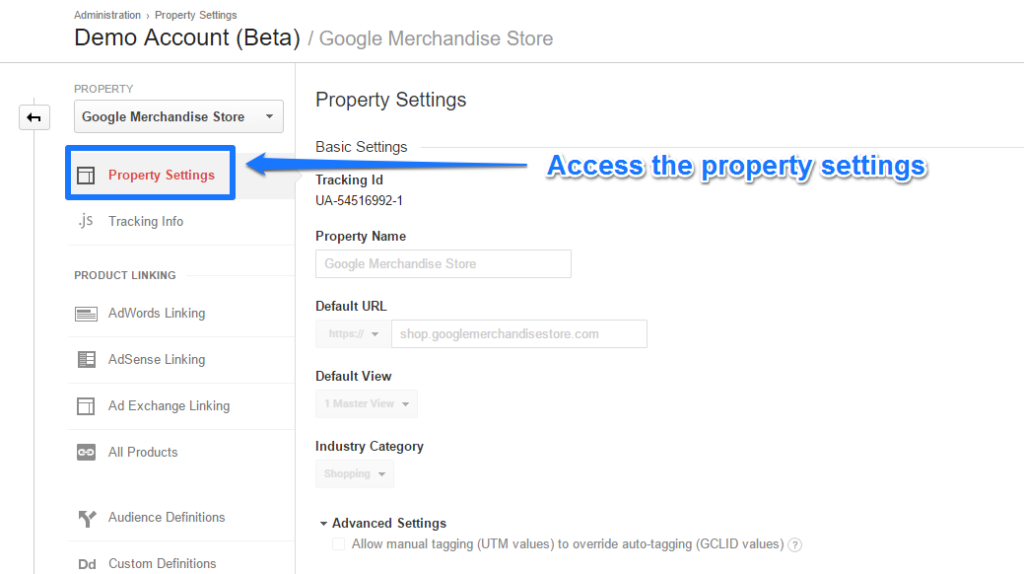 Here is an overview of their property settings:
- Property name and Default URL are set up logically/correctly.
- Default view is set to “master view” which is smart since you will most often go there when exploring your data.
- Industry category is “shopping”.
- They don’t allow manual tagging to overwrite UTM parameters (in 99% of the cases this is correct).
- Demographic and Interest Reports are enabled (additional insights).
- Enhanced link attribution is set up.
- Search Console is integrated with Google Analytics.
This all looks pretty good to me!
4. Tracking Info
Tracking info is located under the property settings. You can modify your data collection process via this menu.
Google has made a few small modifications here:
Change #1: Remarketing and Advertising Reporting Features are enabled.
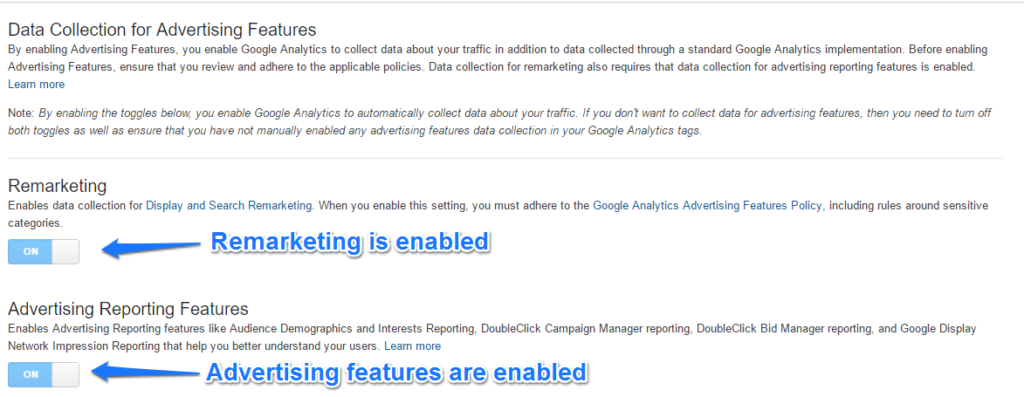 Change # 2: Their own domain is added to the Referral Exclusion List.
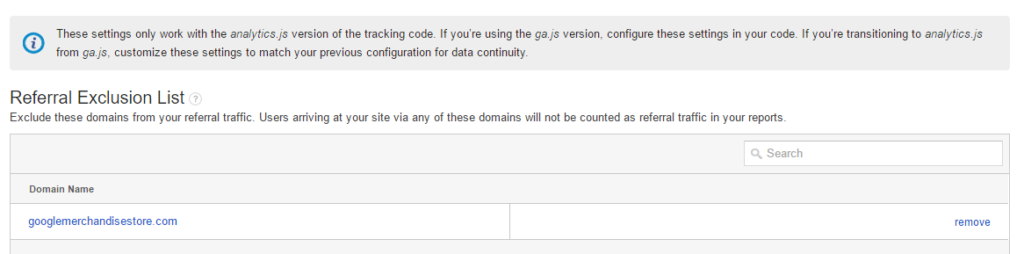 This will prevent their own domain from showing up as a referral in Google Analytics.
For more information on setting up this referral exclusion list, I recommend to read this article by LunaMetrics.
5. Product Links
Currently there are two products linked to Google Analytics: Google AdWords and Search Console.
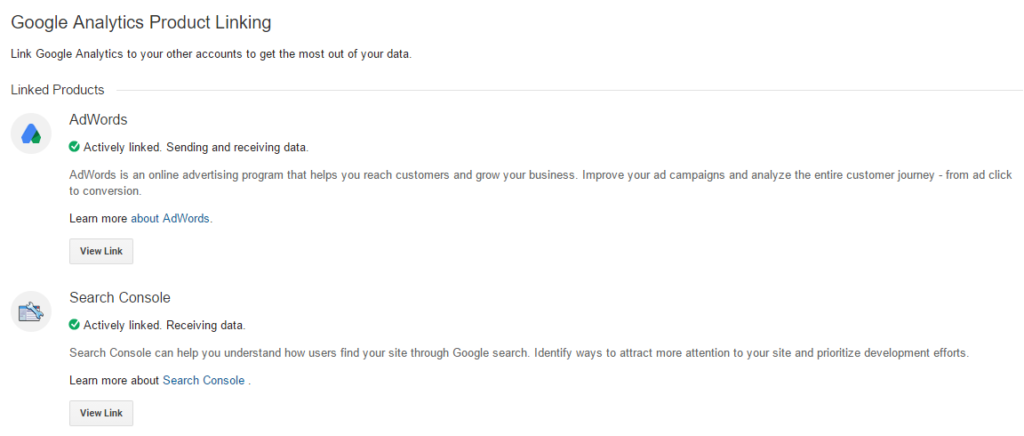 And I cannot agree more with Google here. You should always link these accounts to Google Analytics. Acting on these insights will benefit your bottom line for sure!
You should also connect AdSense to Analytics if you own a blog and make money through AdSense.
6. Custom Dimensions
Custom dimensions allow you to analyze your data in much more depth and context. Applying secondary dimensions is great, but sometimes you need to go beyond the basic set of dimensions available in Google Analytics.
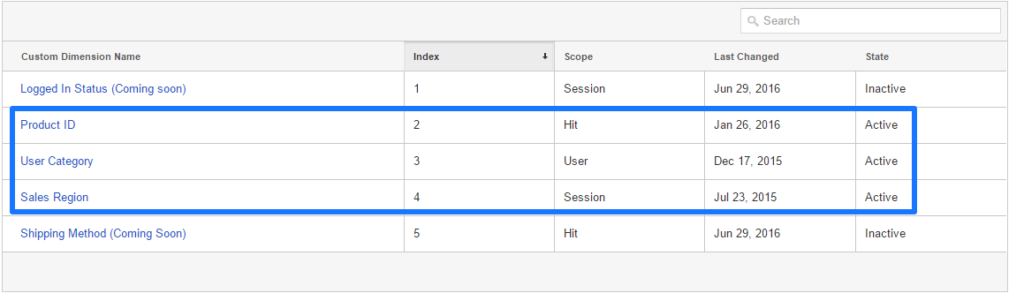 Google has done a great job in setting up a hit, session and user level dimension in Google Analytics. Two new custom dimensions are expected soon!
Later I will explore these dimensions in more depth in the reporting section.
7. Data Import
This looks interesting:
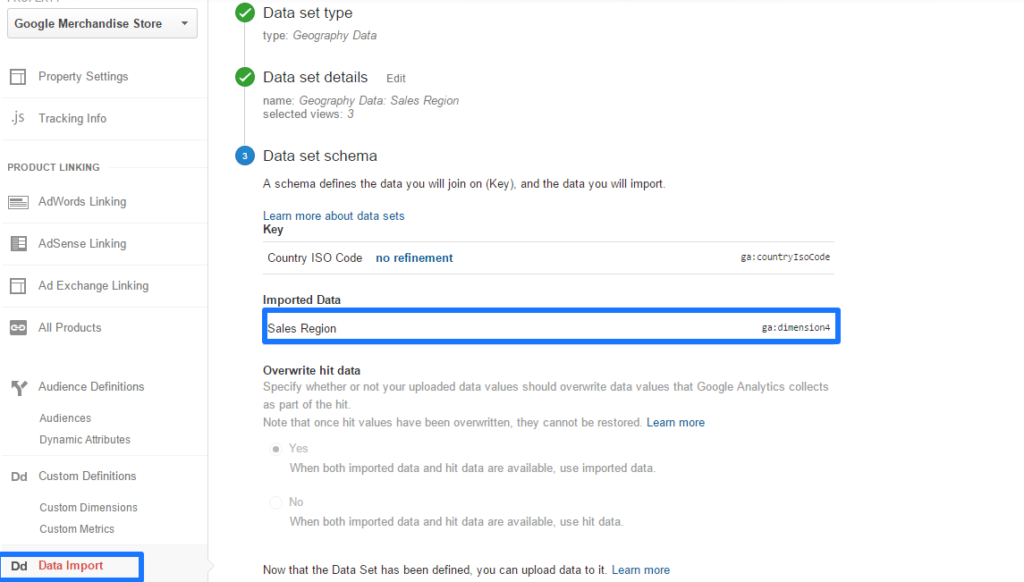 Google has used the “data import” function to connect geographical data (Country ISO Code) to a custom dimension (Sales Region).
Data Import can be very useful if you have external data sources that you want to merge with Google Analytics data.
One of the most powerful features is “cost data upload”:
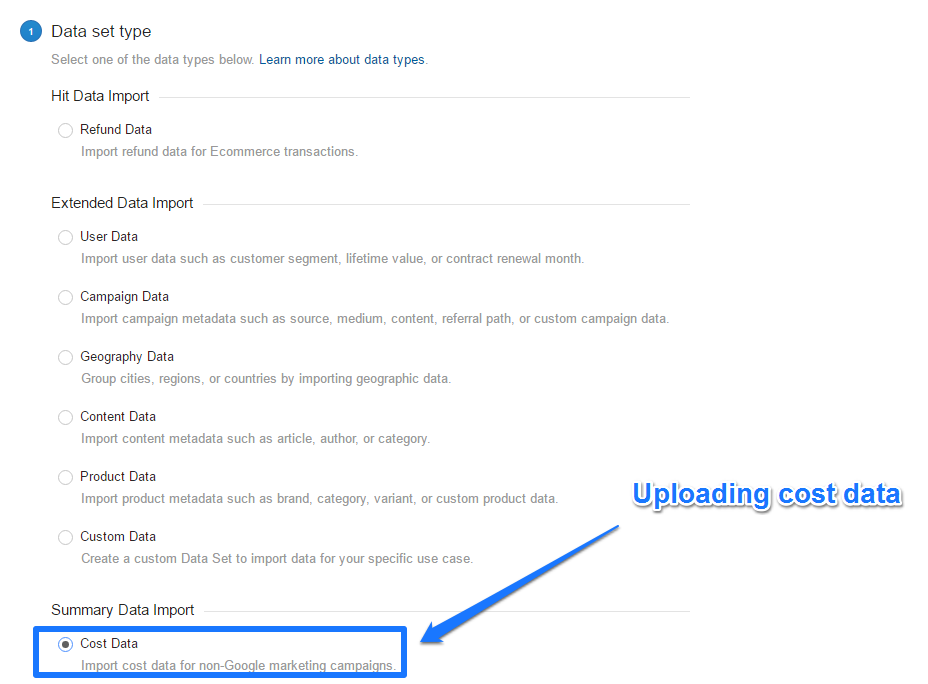
This can be done both manually or automatically via the API.
8. View Settings
I have selected the “master view” (main view) and here are the settings:
- View Name, Website’s URL and Time zone are correctly set up.
- Default page is set to “home”; not sure why since it breaks the content report and it adds this extension to a couple of other pages as well. I would recommend to remove “home” since people will understand the “/” is the homepage.
- Quite a few technical query parameters are excluded, which is good. These parameters duplicate your pages in the content section. Only Analytical/marketing parameters should be preserved. Example in their account: /myaccount.html?mode=billingaddress. You don’t want to remove the “mode” parameter here.
- Currency (USD $) is correctly set up.
- Bot Filtering is on which is good.
- AdWords accounts are linked.
- Site search is implemented correctly and the search parameter is stripped. This is good since no duplicate search result pages will show up now.
Just a few small remarks but for the rest everything looks fine!
9. Goals and Goal Values
Not too long ago I wrote a very comprehensive guide on setting up goals in Google Analytics. Make sure to add it to your reading list!
Here is the Google setup: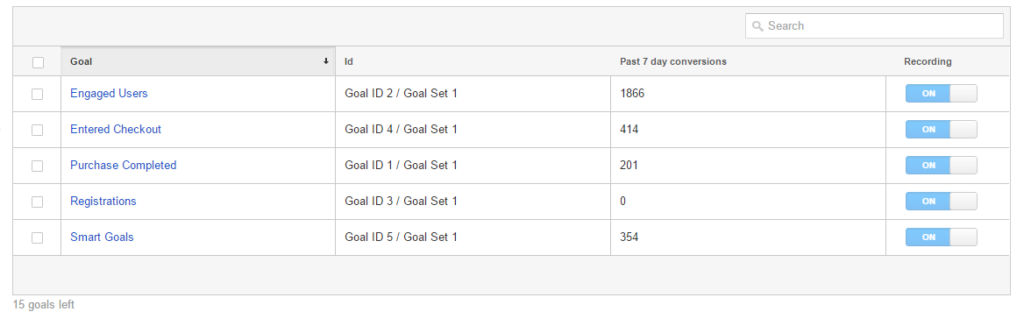 All goals are collecting data with the exception of “registrations” which doesn’t seem to work.
The individual goal details are shown below:
- Goal 1 (Purchase Completed) – destination goal, funnel setup and no goal value. This is good since you don’t want to duplicate values in case of ecommerce tracking.
- Goal 2 (Engaged Users) – engagement goal based on pages/session. For Google, if someone has seen more than 10 pages, this is an engaged user. A quick look reveals that approximately 10% of their users is marked as “engaged”.
- Goal 3 (Registrations) – destination goal, incorrectly configured and/or not up-to-date anymore. I would recommend to turn it off so that you can re-use the goal in the future.
- Goal 4 (Entered Checkout) – destination goal, first page (billing and shipping) in checkout. They might want to add other funnel steps so that they can built and analyze horizontal funnels more easily. However, because of their enhanced ecommerce setup they can still segment funnels.
- Goal 5 (Smart Goals) – they have implemented the smart goals feature in their account.
It’s a good start, but they could probably spend a bit more time to fine-tune their goal setup for maximum insights. Further it looks like they haven’t implemented goal value tracking except for ecommerce transactions.
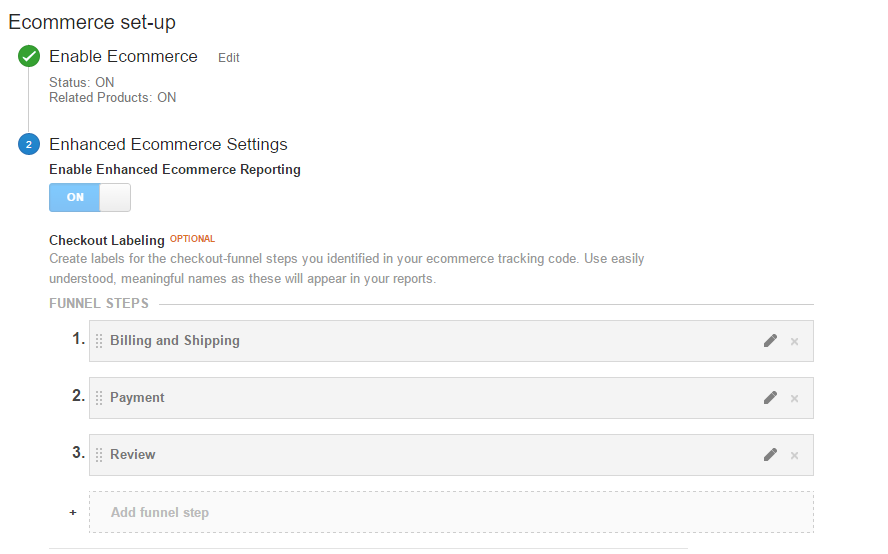
10. Ecommerce Settings
Google has implemented enhanced ecommerce and you have full access to their data! :-)
 The setup looks good so far. In the second part of this article we will explore the reports as well!
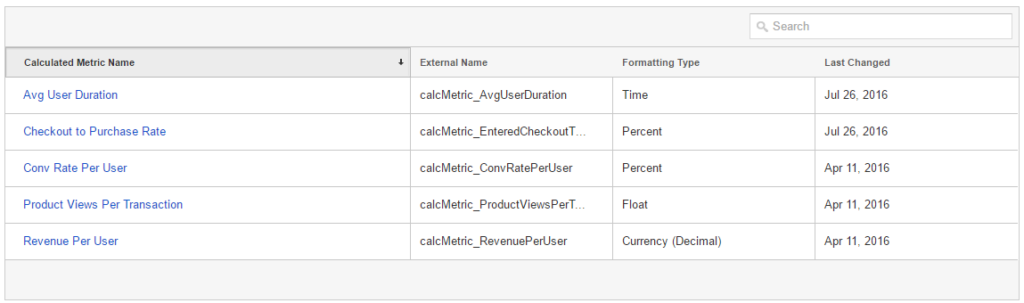
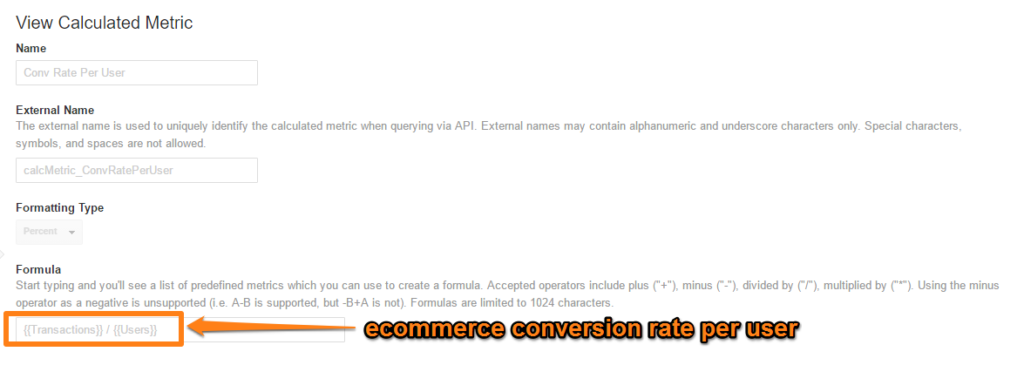
11. Calculated Metrics
It’s great to see Google has set up five calculated metrics (in the “master” view):
 This is one of those cool features you should use!
There are three user level calculated metrics:
- Average User Duration
- Conversion Rate Per User (very useful metric!)
- Revenue Per User (very useful for ecommerce shops)
The conversion rate per user helps you get the closest to the “true” conversion rate. And it is smart to compare this metric to the session-based conversion rate.
In addition they measure the “checkout to purchase rate” and “product views per transaction”. Great ideas to measure the effectivity of their ecommerce shop.
In short, make sure to use the power of calculated metrics in your account! Google has done a great job here and so should you!
You can apply calculated metrics in custom reports, dashboards, widgets and unsampled reports. So what are you waiting for, get started!
12. Annotations
Annotations are set up at the view level and help you to keep track of activities that might influence your data.
This can be changes in your configuration, implementation, but also internal and external marketing activities. While being consistent in setting these up, you have a more easy time explaining changes in your data.
Here is the list of Google:
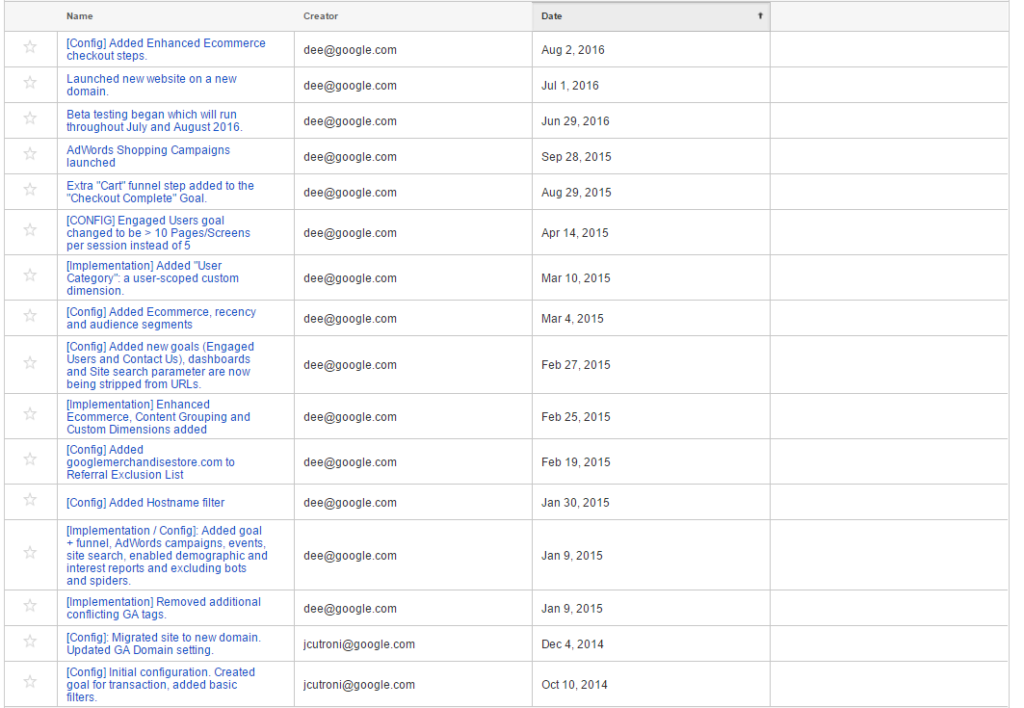 Great to see they have set up quite a few annotations. What I especially like is working with prefixes: [Config] and [Implementation].
This makes it more easy to recognize what has changed and when.
Well, this is it from the administration (account setup) side. I am sure by now you have learned quite a few things about the Google Analytics demo account setup.
I will now guide you through the reporting section of the demo account!
Reporting Section
In the second part of the article we will dive into some of the reports together. I won’t talk about all the reports, just a couple of them that are worthwhile to explore.
For this analysis I will use the data of July 2016.
13. Audience
Navigate to: Audience >> Demographics >> Overview
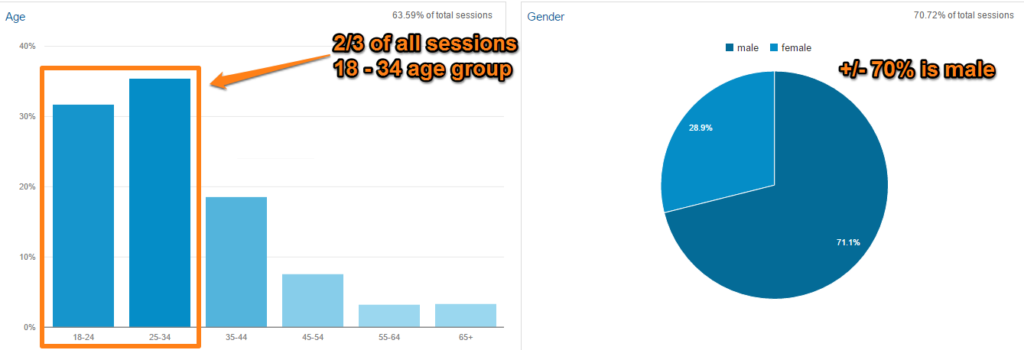 It’s clear that their target audience is relatively young. Most website visitors are male and between 18 and 34 years old. Less than 15% is older than 45 years old.
The age report (Audience >> Demographics >> Age) indicates that the 25 – 34 age group is the most interested and converts the best:
 Young adults below 25 convert far less compared to the age groups 25 to 34 and 35 to 44.
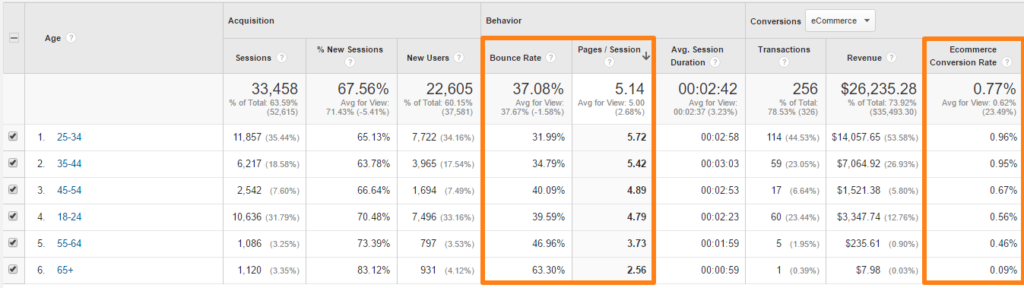
14. Target Market
Let’s have a look at the Location report: Audience >> Geo >> Location.
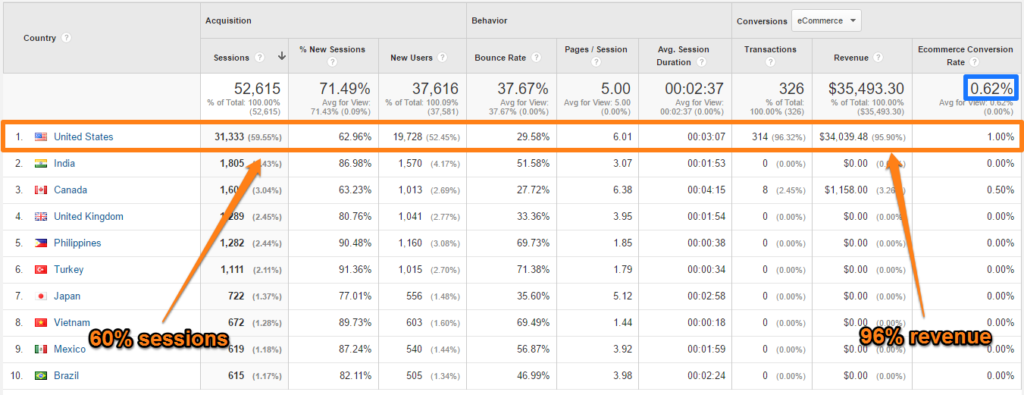 Here are some numbers
- Average ecommerce conversion rate = 0,62%.
- US ecommerce conversion rate = 1,00%.
- Non-US ecommerce conversion rate = 0,06%.
In my opinion it makes sense here to set up a separate view for traffic from United States. This is clearly the target market of the Google Merchandise Store. The conversions outside of United States are close to zero.
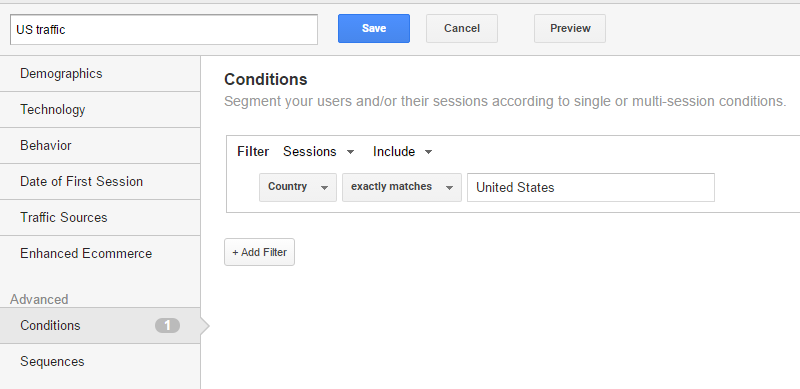
Filter (United States)
Here is how to set up a country filter on United States traffic:
![Include Filter US Traffic]() Segment (United States)
Segment (United States)
 Segment (United States)
It is also possible to segment on US traffic:
 And here is the location report:
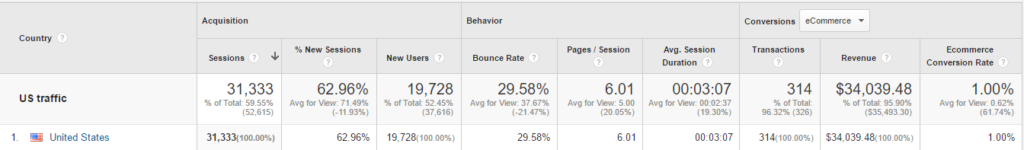 With this segment applied we can now review all reports for only the United States.
Please note that I will analyze the next set of reports with the United States segment applied. This is their target market and we like to know more about the characteristics of this group.
15. New vs Returning Visitors
Most ecommerce shops tend to have a higher conversion rate on returning visits.
Navigate to: Audience >> Behavior >> New vs Returning.
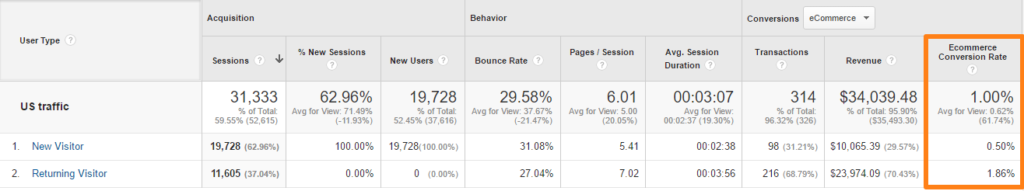 The same is true for Google’s shop.
The ecommerce CR for returning visitors is three times higher than the ecommerce CR of new visitors.
Take into account that these percentages (new vs returning) are not very accurate in general. If someone deletes their cookies or returns via another browser or device, she is seen as a new visitor. One thing is clear here: returning visitors convert far better. Running remarketing campaigns might be very profitable!
16. Conversion Rate per Device
The new visitor percentage is much more inflated if a lot of people enter the website via multiple devices. I feel 60% is rather low for new visitor session percentage. Well, they haven’t filtered out any IP addresses…
It is interesting as well to examine the device category report:
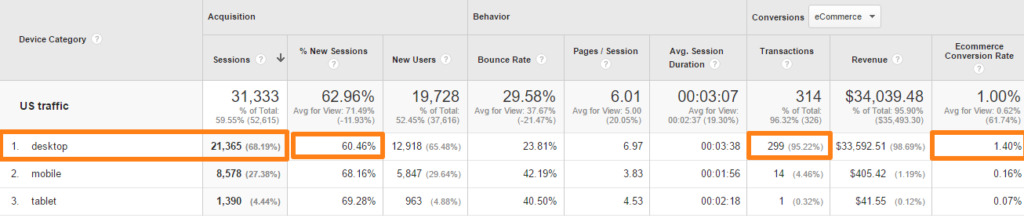 What do we see here!
Conversion rates on mobile and tablet are terrible. Close to 99% of all revenue comes from desktop. :-)
“Did Google not spend enough time to optimize their website for mobile visitors or do people simply buy on desktop?”
Here is what we know this far:
- Main age group (target) for Google’s shop is 25 to 34 years old.
- 70% is male.
- 60% of website visitors reside in United States.
- Over 95% of revenue comes from United States.
- Returning visitors are much more valuable for this shop.
- Desktop is by far the best (the only) converting device type (99% of revenue!).
And very probably a lot of their own employees are buying Google products. :-)
17. Channels
I recommend to check out the channel overview report.
Your “source/medium” reports will not be accurate at all if you have messed up your campaign tracking. In addition your social measurements are often categorized as a referral which is bad.
Navigate to: Acquisition >> All Traffic >> Channels.
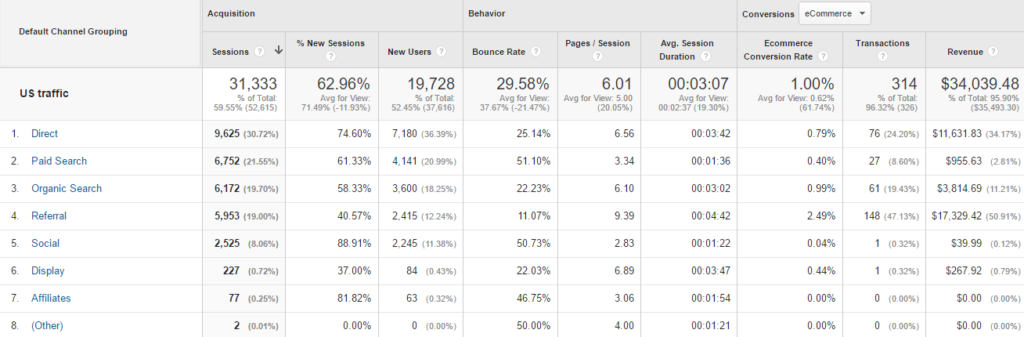 A lot of direct (Google employees?) transactions and it seems that referrals make up a lot of their conversions.
Clicking through at referrals will reveal the following stats:
- mall.googleplex.com: 4.989 sessions and 138 transactions.
We now know that the majority of transactions come from Googlers. That’s why they don’t want to filter their own IP. ;-)
Paid search data reveals that many transactions come from brand related keywords (as expected).
18. Search Console Data
You need to deselect any segment if you want to explore the Search Console reports in Google Analytics.
Navigate to: Acquisition >> Search Console >> Queries.
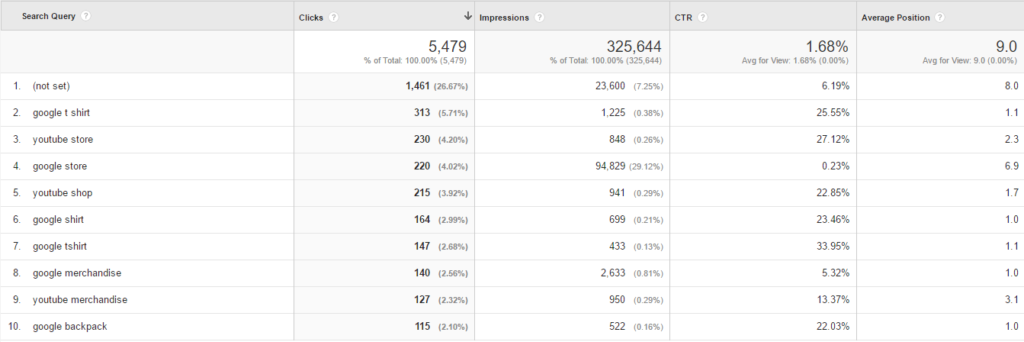 Impressions data:
- 92% of search impressions are revealed.
- > 70% search impressions are brand/Google related.
- 20% search impressions are non-Google.
- 10% search impressions are Youtube/merchandise related.
- < 10% search impressions are non-brand related.
Let’s say this shop doesn’t aim for top positions on competitive terms. The analysis I made above you can do for any shop where Search Console data is imported in Google Analytics.
Here is a useful article about the background of Search Console data.
19. Internal Site Search
The internal site search report usually reveals a great deal of the user intent of site visitors.
In Google’s case this is the list of search queries (Behavior >> Site Search >> Search Terms):
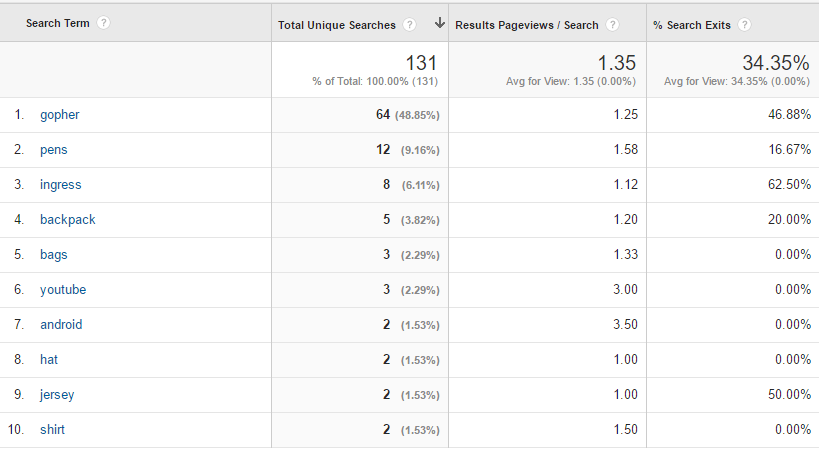 In one month just over 100 search queries, not too useful to further analyze. The annotations show that the new website was launched on July 1st.
Make a monthly comparison of this report: Behavior >> Site Search >> Usage.
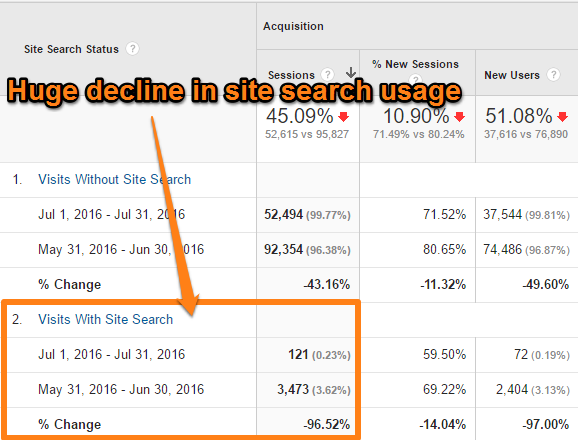 Bingo, they have probably made the Site Search less prominent on their website. Or there are some technical (measurement) issues they haven’t taken care of.
20. Event Measurements
Let’s have a look at their event tracking measurements (Behavior >> Events >> Top Events).
![Event Tracking report]() Enhanced Ecommerce
Enhanced Ecommerce
This is an exciting module. Here we go:
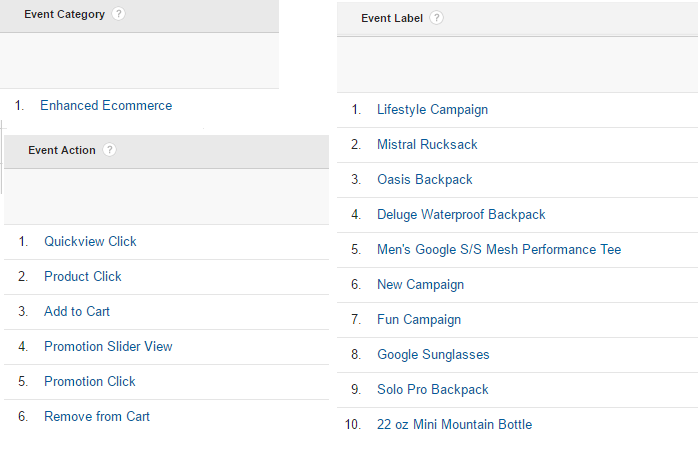 They measure quite a few (basic) ecommerce events that will enrich your overall data set, insights and optimization possibilities.
Exited
The data being stored here is not useful.
Contact Us
Under the topic “contact us” four different events are triggered:
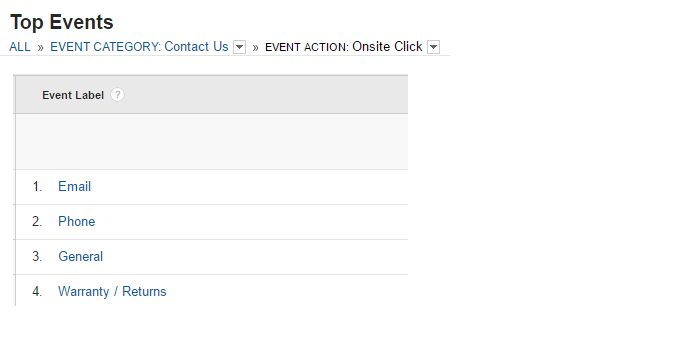 You can use a debugging tool to find out where/how the events are exactly triggered.
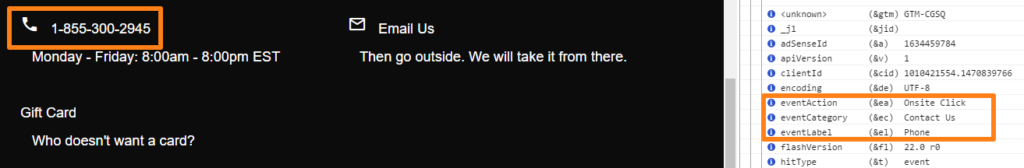
Phone link click (Google Analytics Debugger):
21. Content Groupings
Make sure to read my in-depth guide on content groupings if you are new to this feature.
Content groupings are very useful if you want to analyze your content at a more aggregated level.
Navigate to: Behavior >> Site Content >> All Pages.
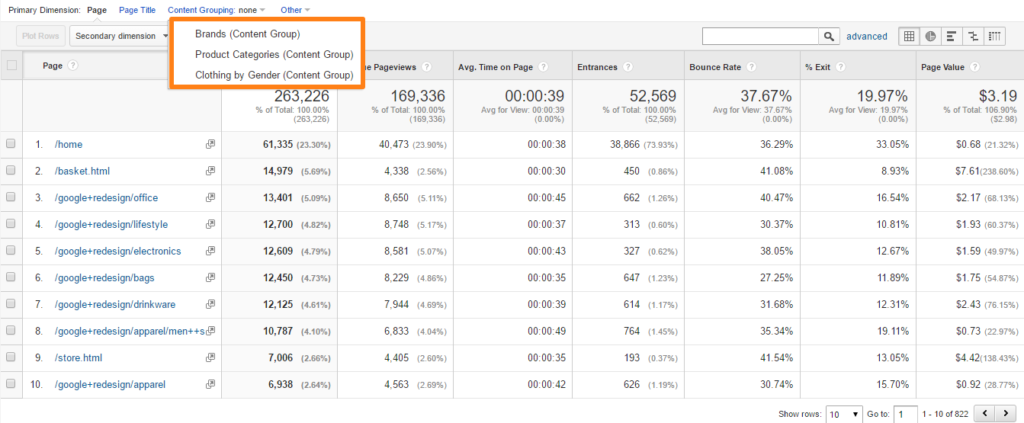 Here is what we know:
- There are 822 URLs measured.
- They have three different content groupings:
- Brands
- Product Categories
- Clothing by Gender
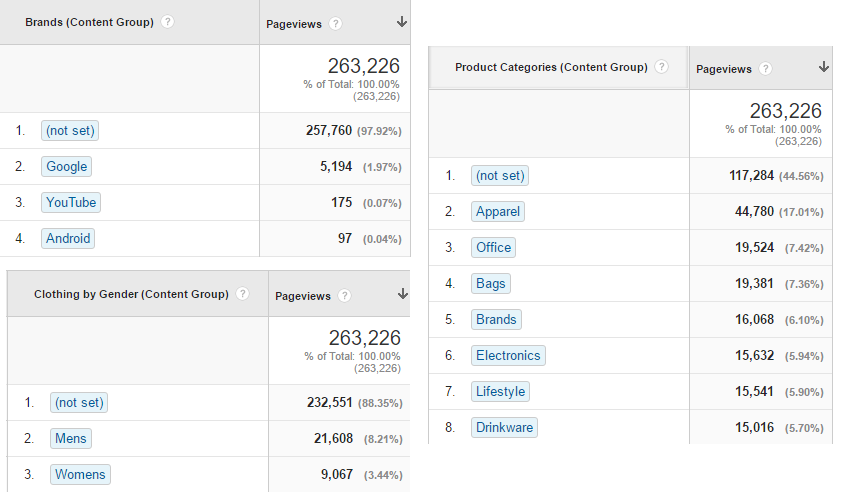 You can analyze the different content groups in relation to how many pageviews etc. they have. The “brands” and “clothing” group contain a lot of (not set) values. Just a small percentage of the queries fall in one of the buckets.
In addition you can see the effectivity of each landing page group (e.g. product categories):
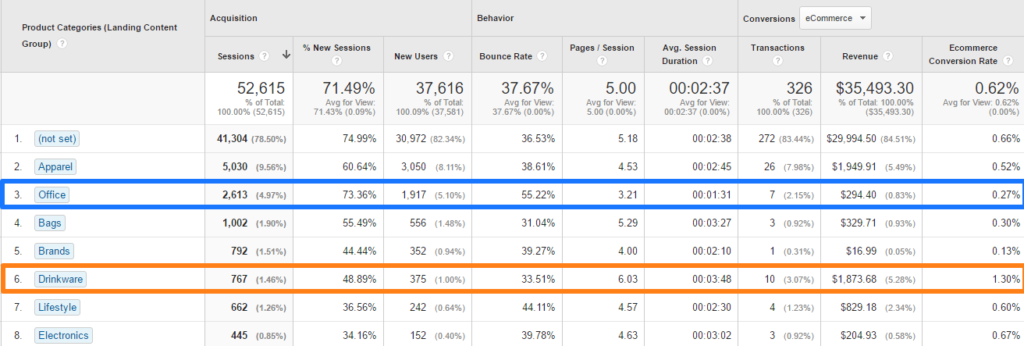
Although numbers are rather low, we could conclude that “drinkware” landing pages convert far better than “office” landing pages. It’s much more easy to compare different categories here than in the default “all pages” report.
Another way to make this information useful is by applying it to the navigation summary report.
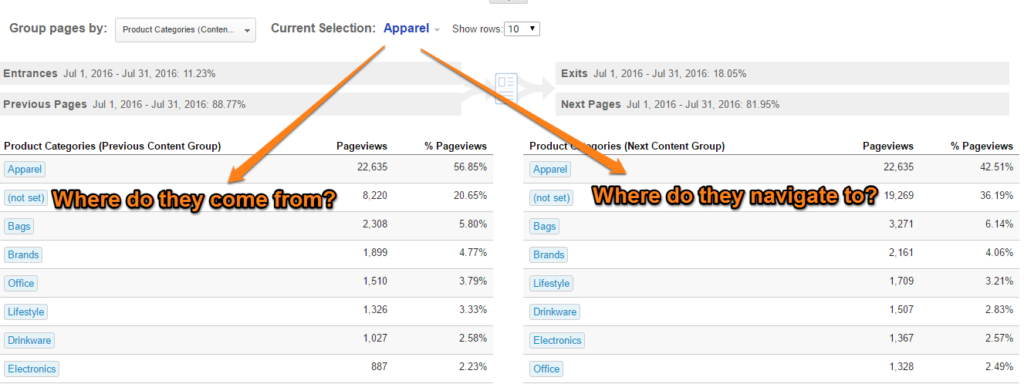 You could find out whether people stay in the same category when they browse your site. If that’s the case, you could optimize one specific mini-shop for your visitors. There are a lot of insights to be gained when analyzing your content groupings!
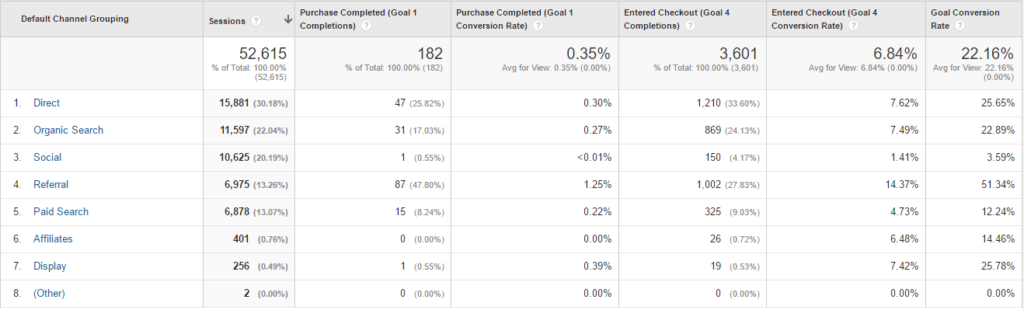
22. Conversions
Obviously the main conversion in the Google Analytics demo account is a transaction, but we will get there in a minute.
In the admin section we saw they have set up a couple of goals.
It’s better to put these goals in perspective instead of looking at plain, absolute conversion numbers.
For example, you want to know how each of their channels (on the overall level) performs.
Navigate to: Acquisition >> All Traffic >> Channels.
This is the report that initially shows up:
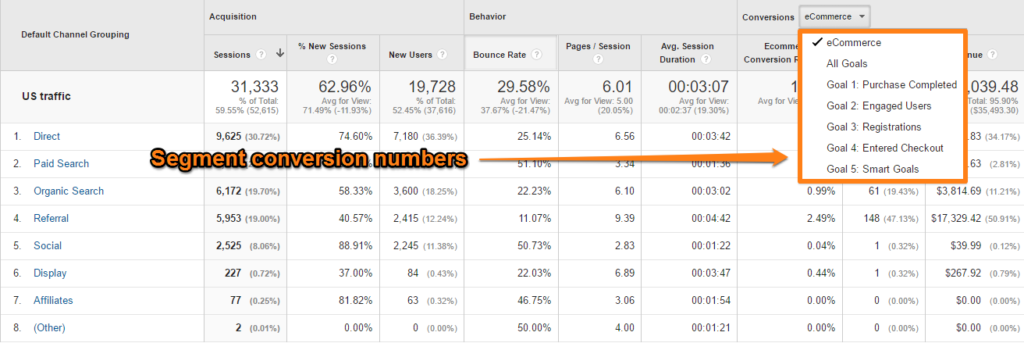 You have three options here:
- Analyze your channels on the ecommerce conversion (rate).
- Analyze your channels on overall goal conversion (rate).
- Analyze your channels on one individual goal conversion (rate).
The first option only makes sense if you have ecommerce enabled and implemented on your site.
Read all about the difference between ecommerce and goals.
Very often optimizing on the overall goal conversion rate is not the smartest thing to do. This is because a lot of companies set very “easy” goals that have a conversion rate of over 20 or 30%. This will ruin your overall goal conversion rate (which will become too high).
That’s why most companies benefit the most from optimizing an individual goal or on a few goals instead of all.
We already know that “internal” conversions from Googlers is what makes up the majority of conversions. So we don’t have to dive into that deeper now.
One more thing, you can build a custom report to examine different conversion metrics in one report:
 This can be very useful if you just want to concentrate on conversion metrics.
There are several ways to analyze your conversion rate in context. I usually like to start with analyzing the channel conversion rate before moving on to other segments or dimensions.
23. Custom Dimensions and Reports
A short recap on the custom dimensions that are in use:
![Custom Dimensions overview]() User Category (User level)
User Category (User level)
A quick way to retrieve all values is by setting up a segment on the custom dimension:
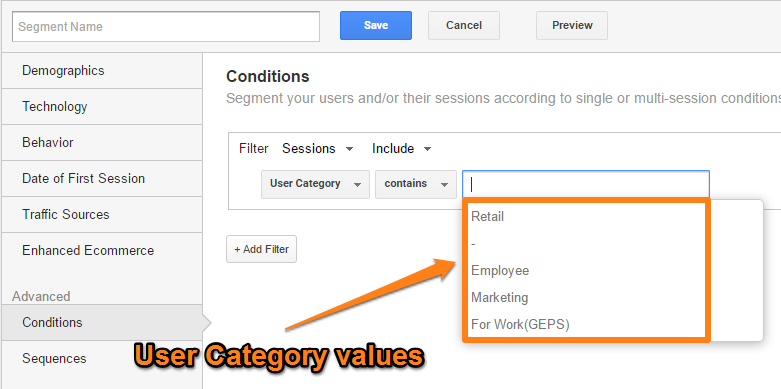 Just point your cursor in the empty field and all values will show up.
Let’s have look at one of the reports:
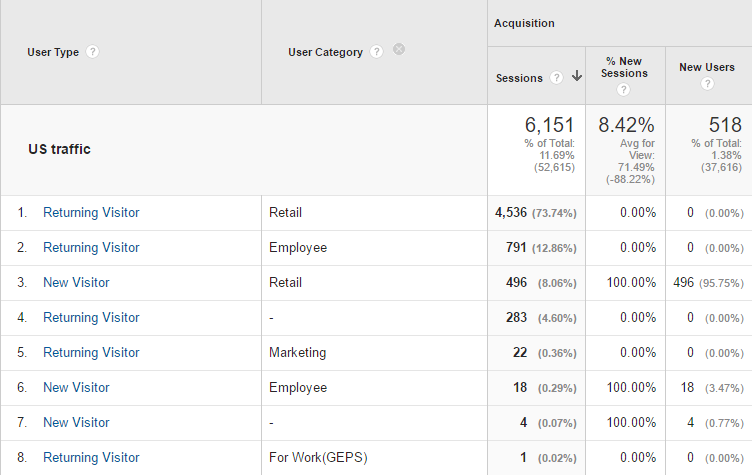
A few things to note here:
- The sessions include only those where the custom dimension is set (6.151 of 31.133)
- Most people fall in the category “Retail”.
- You need to have more background information to make this dimension insightful and actionable.
Sales Region (Session level)
The second dimension (session level) is “Sales Region”.
Let’s see how many sessions and transactions came from which “Sales Region”:
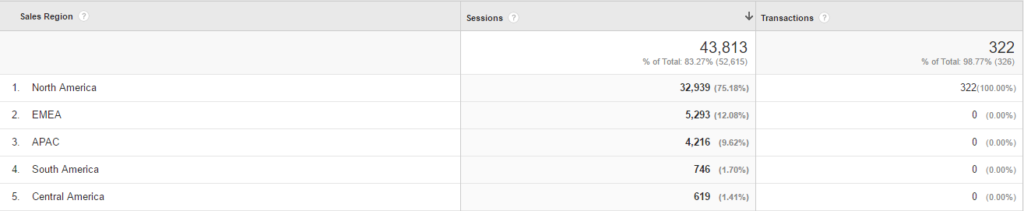
Great, we now know that you can use a custom dimension as:
- Primary dimension in custom report.
- Secondary dimension in standard or custom report.
- Building stone (custom dimension value(s)) for segment.
Yes, custom dimensions are really powerful!
Product ID (Hit level)
Usually the product ID is used in ecommerce reporting:
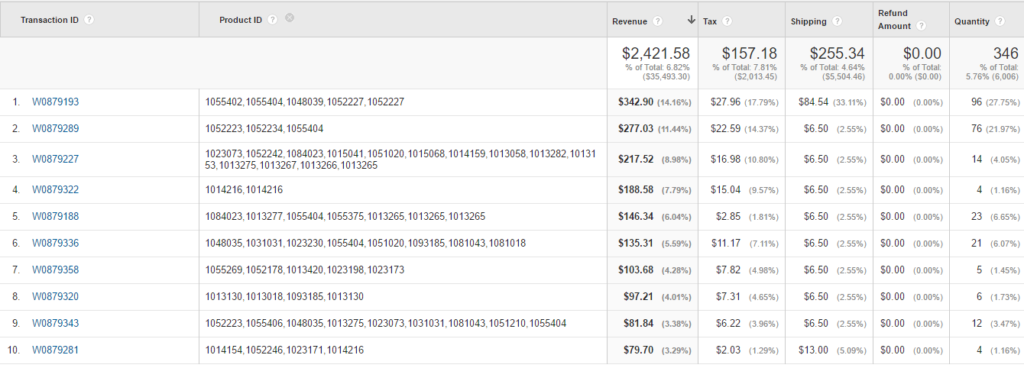 Without background information or further analysis of their measurements, we can’t make a lot of sense of this data. But it’s great to see they use several custom dimensions to enrich their data.
Do you want to know more about custom dimensions? Read this custom dimensions support article by Google first.
24. Calculated Metrics in Custom Report
Calculated metrics are one of these features you need to set up!
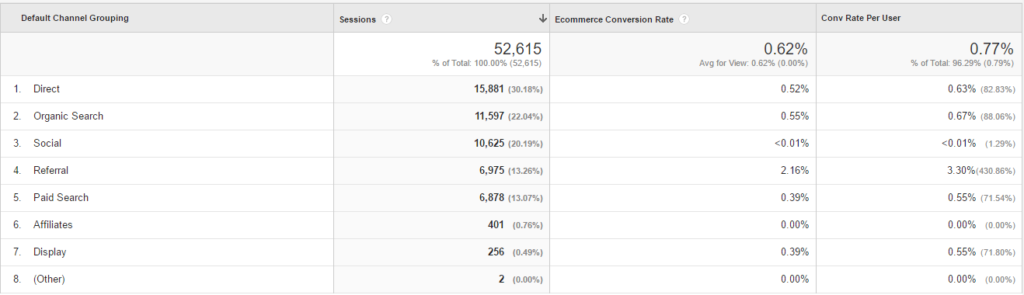
One of the metrics Google has defined is conversion rate per user:
 And to be a bit more specific, it’s the ecommerce conversion rate per user.
The beauty of calculated metrics is that you can apply them to historical data as well!
One of the use cases could be to set up a custom report and apply the user level ecommerce conversion rate in addition to the default one (session based).
 The difference between the session and user level conversion rate depends on the numbers of sessions a visitor has compared to conversion. And in addition the accuracy of cross-session measurement will also influence the difference between both metrics.
Yehoshua Coren has written a great article on custom metrics and calculated metrics. Make sure to check it out!
25. Enhanced Ecommerce Reports
Last, but not least, enhanced ecommerce reporting!
You are excited I guess. Now EVERYONE has the opportunity to review real-world data from an ecommerce shop!
Navigate to: Conversions >> Ecommerce >> Overview.
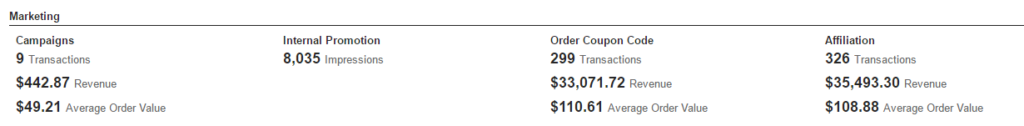 This is great data! Smart tagging enables you to track internal promotions.
Here is another report that is worth checking out:
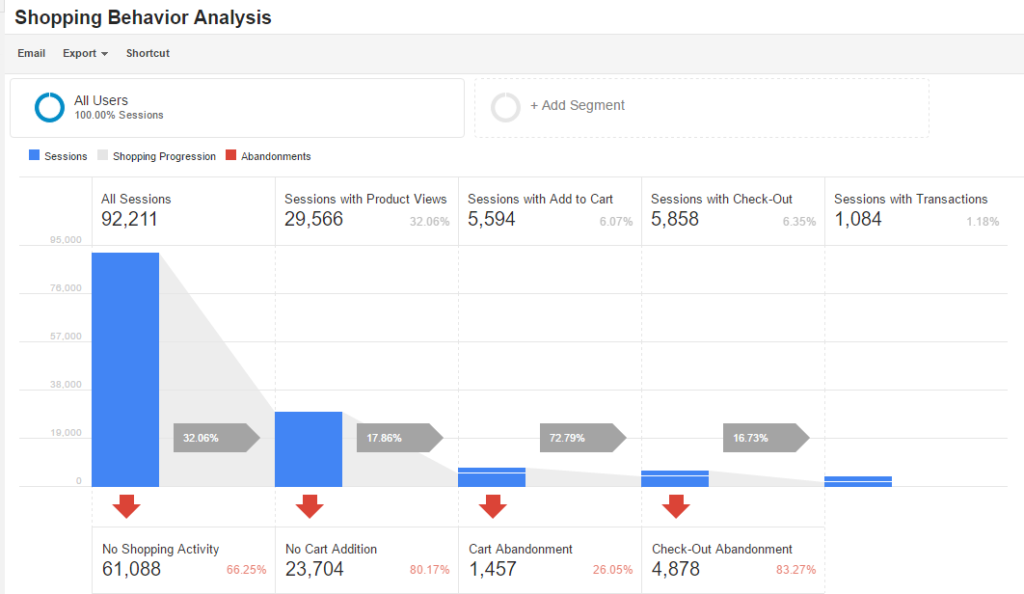
What do we see here:
- Only in 32% of all sessions a product page is actually visited.
- Of this group less than 20% adds a product to the cart.
- The majority of this group continues to the check-out (73%).
- 1 of 6 people that enter the check-out actually buys a product. There are a lot of “explorers” that don’t buy!
This is fantastic information to use to optimize every part of the funnel.
And the beauty is that you are able to segment this shopping funnel:
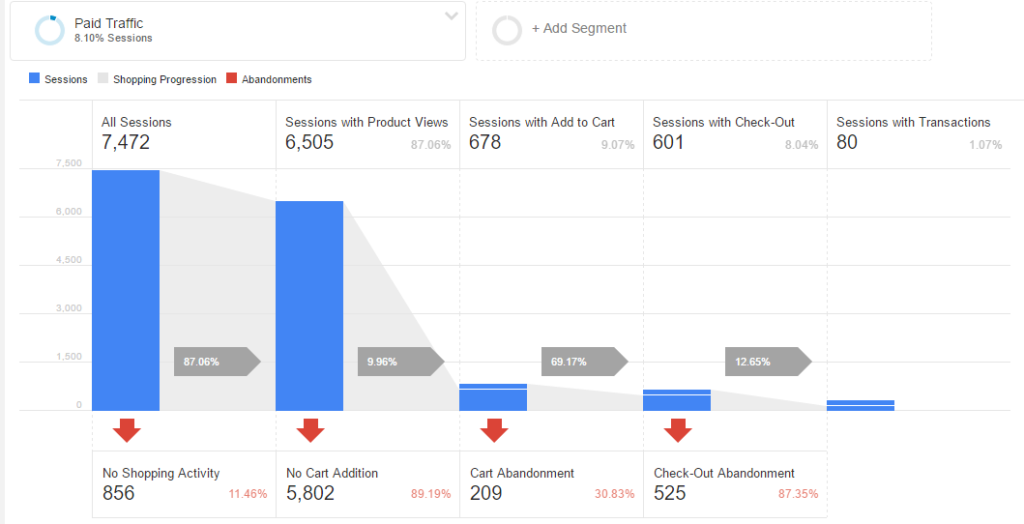 The very high percentage of “All Sessions >> Sessions with Product Views” is likely due to many visitors entering the website on a product page.
I could write a lot more, but you will learn the most if you explore some reports by yourself as well! :-)
In short, the Google Analytics demo account is THE opportunity to learn with real-world data!
Did I miss something? Happy to hear your thoughts and I would greatly appreciate if you share it with your audience!
One last thing... Make sure to get my extensive checklist for your Google Analytics setup. It contains 50+ crucial things to take into account when setting up Google Analytics.Download My Google Analytics Setup Cheat Sheet
The post In-Depth Case Study: Top 25 Takeaways from The Google Analytics Demo Account appeared first on Online Metrics.