Do you take the majority of your business decisions only on last-click performance data? The Multi-Channel Funnels can provide a lot of insights other reports can’t.
In general, many conclusions are drawn based on the standard reports in Google Analytics. However, one of the drawbacks is that most reports provide conversion information on a last-cookie basis.
 This is suboptimal as certain channels might be a lot more valuable than the “standard” data reveals! That’s why I recommend combining the insights from multiple angles.
In this blogpost I will provide an in-depth overview of the Multi-Channel Reports and how they can help you and your business.
Table of Contents
- Introduction to Multi-Channel Funnels
- Five Standard Reports
- Channel Groupings in MCF Reports
- MCF Segments
- MCF Analysis & Optimization
- MCF Reporting API
- MCF Challenges
- Concluding Thoughts
Let’s dive right in!
Introduction to Multi-Channel Funnels
In simple terms, the Multi-Channel Funnels show how your marketing channels (traffic sources) work together to generate sales or other conversions on your site.
This is very valuable as in Analytics, conversions and transactions are credited to the last touchpoint (campaign, search, or ad) that referred the user when she converted.
But you probably want to know what role other touchpoints play in your conversions? And how much time passed between the user’s first visit and her purchase?
This is where the MCF reports really come in handy! You should devote a lot of your time to these reports if you are responsible for driving traffic to the website.
Note: on default your Multi-Channel Funnels won’t report the behavior across multiple browsers and devices.
Prerequisites
Setting up goal and/or ecommerce tracking is crucial for any online business.
In order to enable the MCF reports, you need to set up goals and/or ecommerce tracking.
 Read these articles for more in-depth information on setting up your measurement plan and goals:
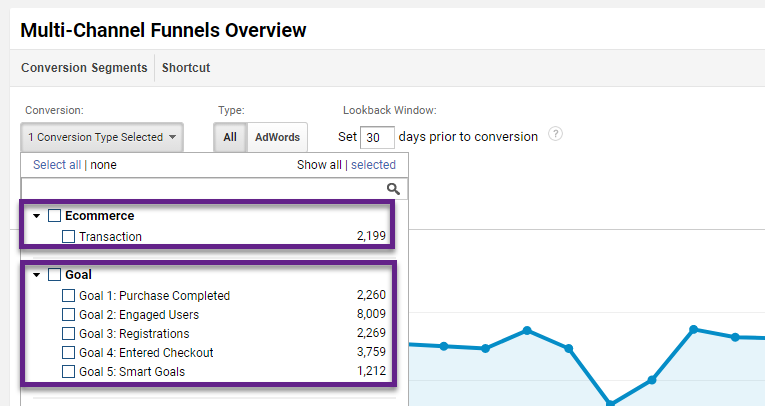
Conversion Type
The MCF reports allow you to analyze all your channels or to look at your AdWords data separately.
Here is how the reports would look like:
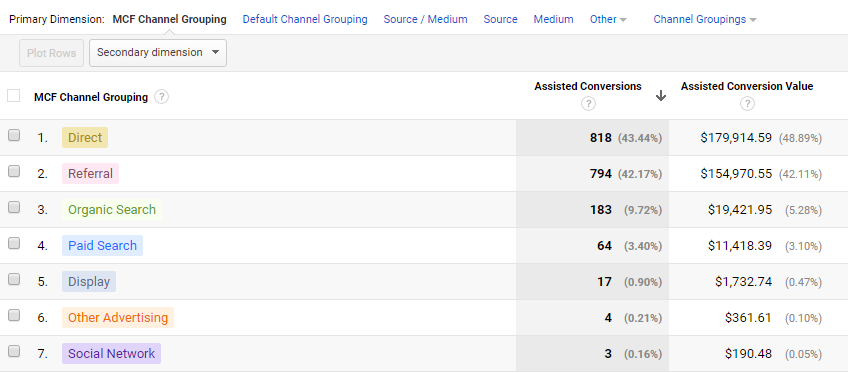
Option 1: All Channels.
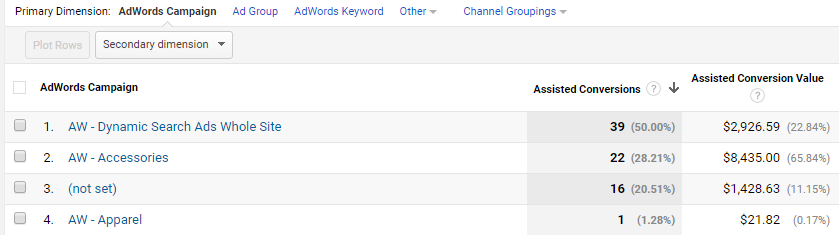
Option 2: AdWords.
It can be valuable to isolate your AdWords channel, but most often I take a more holistic approach and evaluate all channels together.
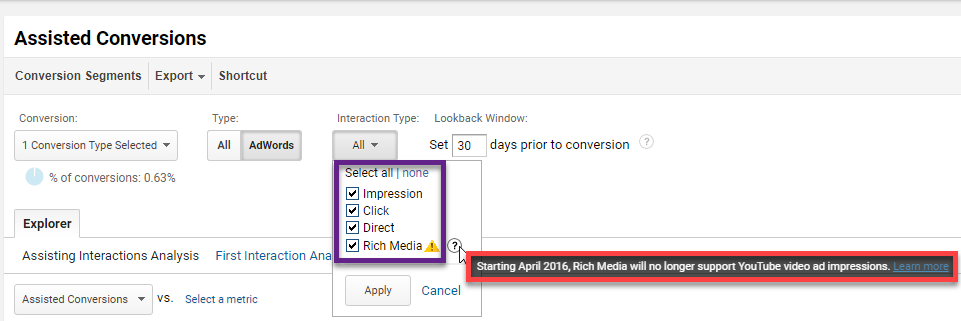
Interaction Type
It depends on your marketing channels, but some of the interactions are primarily useful for Display advertisers who have YouTube or Display Engagement Ads in their ad mix.
By default, all types are included.
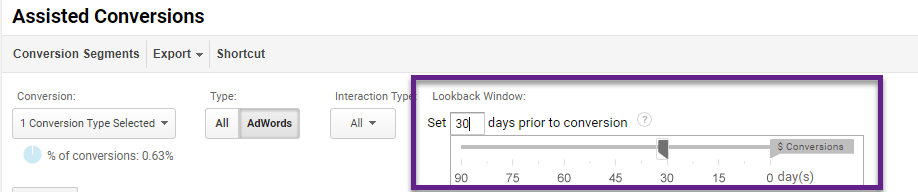
Lookback Window
The default is a 30-day lookback, but it can be useful for many businesses to extend the lookback window to 90 days (maximum). This allows for a more complete attribution story.
For example:
- Peter: clicks to your website on September 15th 2017 (AdWords campaign).
- Peter: converts on your website on December 2nd 2017 (Organic search).
There were no visits in between.
With a lookback window of 30-days you will lack some insights on his story. However, 90 days would be enough to see AdWords assisting in this conversion.
However, it is always debatable whether after a certain amount of time AdWords should still be seen as the first trigger for this conversion.
In general, the more involved, extensive sales funnels in your business, the longer you want to set the Lookback Window.
Direct Traffic
Do you know that direct traffic is treated differently in the Multi-Channel Funnel reports?
“Normal” Reports
Direct traffic won’t get any credit for conversion unless it is the first and last touchpoint before a conversion takes place.
Standard cookie duration time is six months.
An example:
- Day 1: visitor comes on your website, traffic source = AdWords campaign.
- Day 179: visitor comes back on your website, traffic source = Direct. Visitor buys your product.
In this case, all credit for conversion goes to the AdWords campaign. Direct traffic doesn’t get credit for conversions unless someone has waited more than six months to return to the site, deleted her cookies or came back on another device or browser.
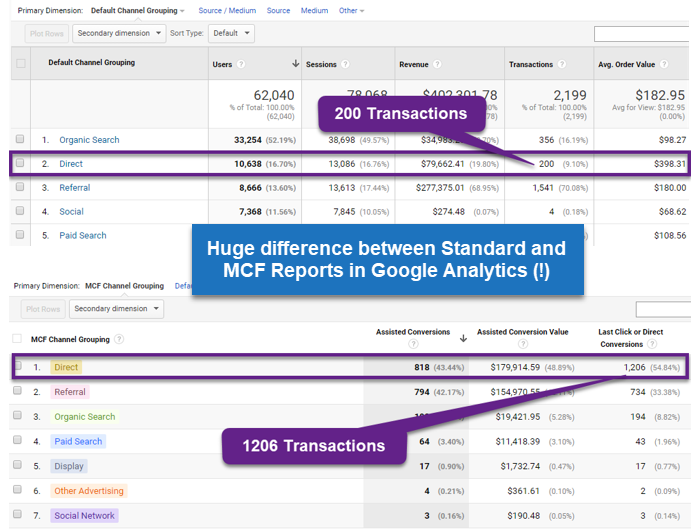
Here are some numbers (30 days period):
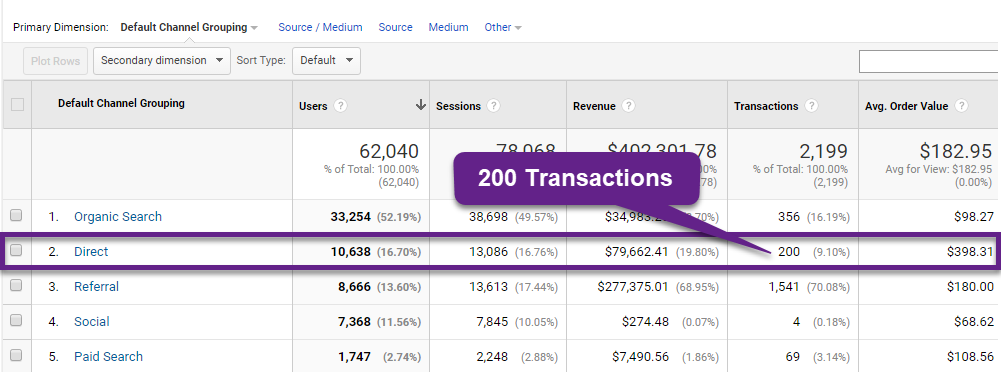
Multi-Channel Funnel Reports
I have left the Lookback Window at 30 days as it doesn’t impact Last Click conversions.
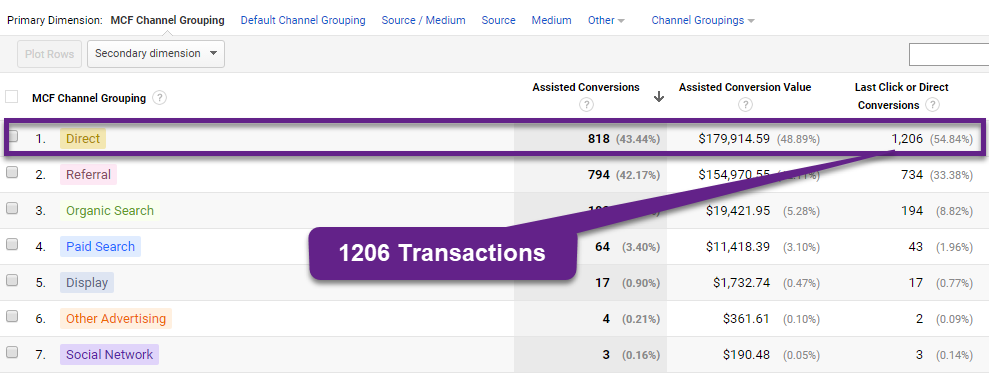 What a difference right!
In this situation Direct traffic is treated in the same way as all other (marketing) channels. This is causing a huge uplift in transactions credited on Direct.
Five Standard Reports
Google Analytics has five standard reports everyone (with goals and/or ecommerce enabled) can access.
In this chapter I will give a quick introduction. These reports are very useful for any business with multiple channels driving traffic to their site.
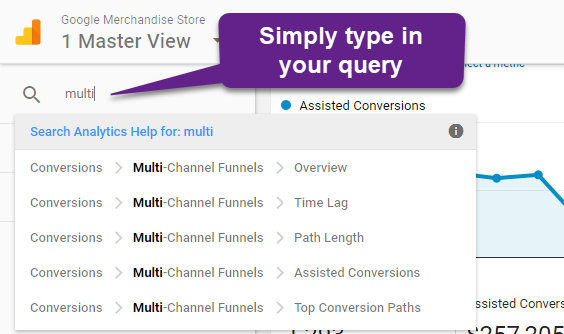
Navigate to Conversions >> Multi-Channel Funnels. You will find all reports in this subdirectory.
Tip: you can also use the Search field to quickly find any report you need.
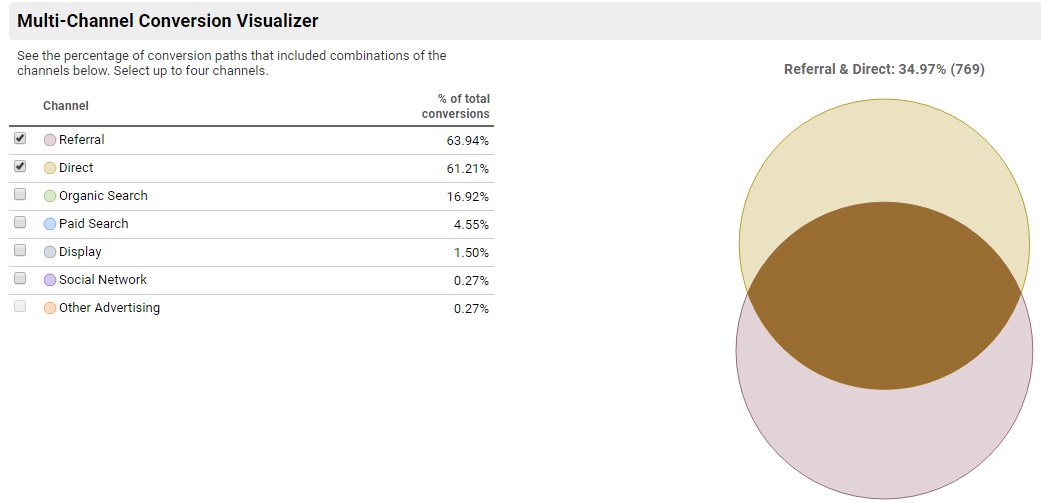
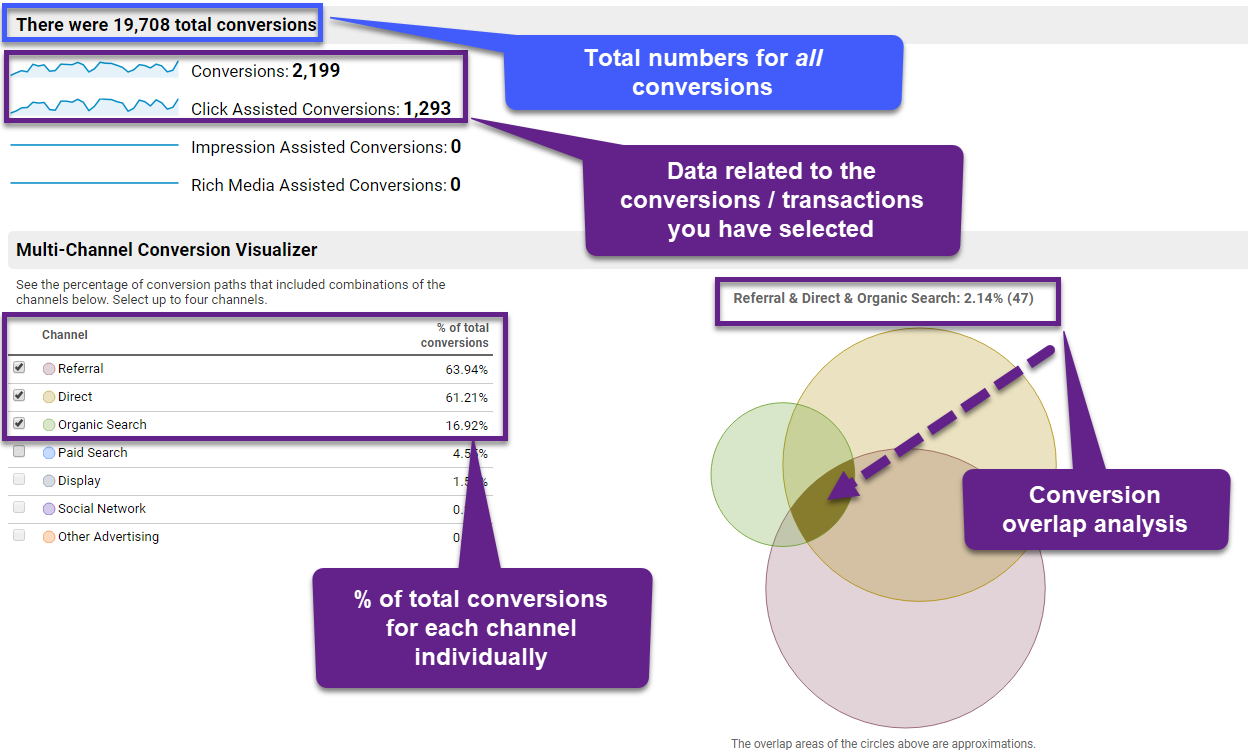
Report 1: Overview
This report provides you with a quick visual overview of your conversions and the attribution of each of your channels.
There is a dynamic element as you can select which channels to group and compare.
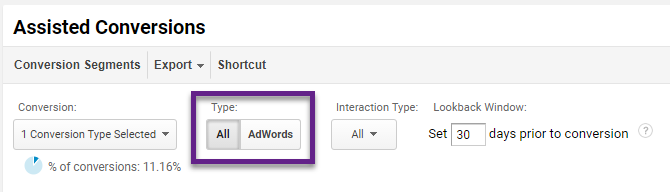
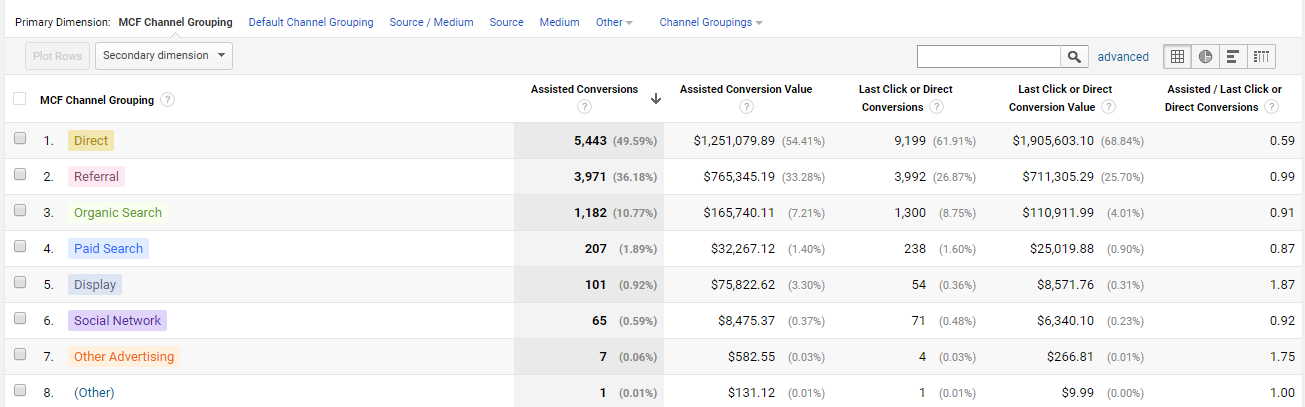
Report 2: Assisted Conversion
This report provides in-depth information on the role of each of your channels and their performance.
These terms are important to understand:
- Assisted Conversion: the number of conversions for which this channel appeared on the conversion path, but was not the final conversion interaction.
- Assisted Conversion Value: the value of the conversions assisted by this channel.
- Last Click or Direct Conversions: the number of conversions for which this channel was the final conversion interaction.
- Last Click or Direct Conversion Value: the value of the conversions for which this channel was the final conversion interaction.
- Assisted / Last Click or Direct Conversions: a value close to 0 indicates that this channel functioned primarily as the final conversion interaction. A value close to 1 indicates that this channel functioned equally in an assist role and as the final conversion interaction. The more this value exceeds 1, the more this channel functioned in an assist role.
I will further elaborate on this report in the advanced section of this article.
For now, keep in mind:
- As always with numbers, only evaluate channels that have a decent amount of conversions/transactions. In the example above, “Other Advertising” has too low numbers.
- Switch to other dimensions (e.g. Medium) to create a different overview for your analysis.
- Click on a particular channel to make a trend analysis on the channel level.
Report 3: Top Conversion Paths
The Top Conversion Paths relate to the channels that drove the sessions leading up to the conversion (including last touchpoint/channel).
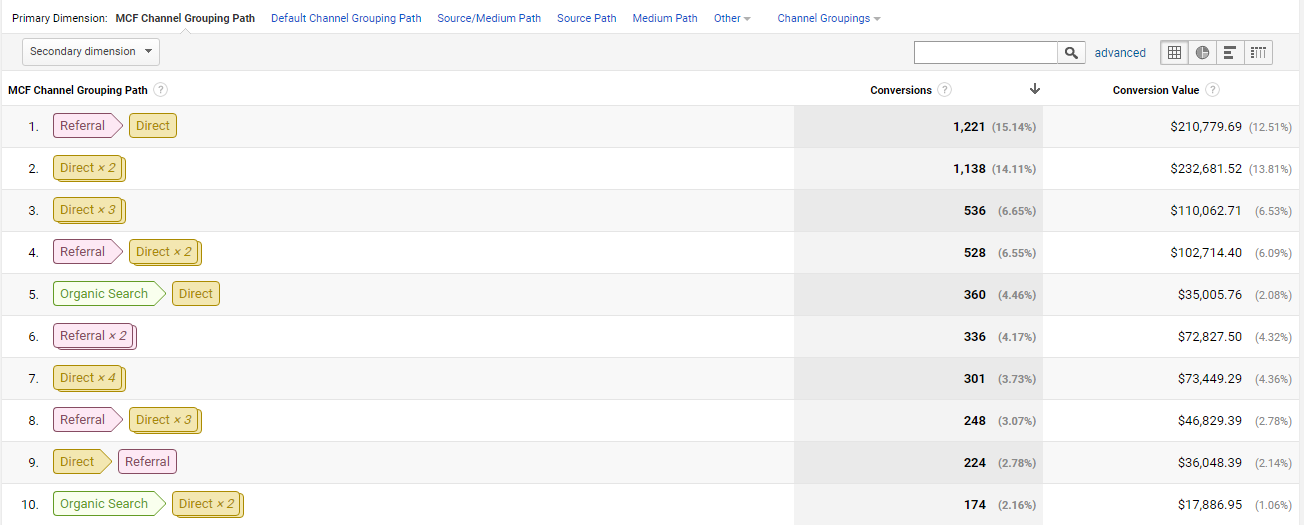
In the table above you can evaluate the conversion paths that drove the most conversions. Thereby searching on a particular channel gives more insights in the role of that channel and where the channel occurs on the path to conversion.
On top of the report, you can indicate the length of conversion path:
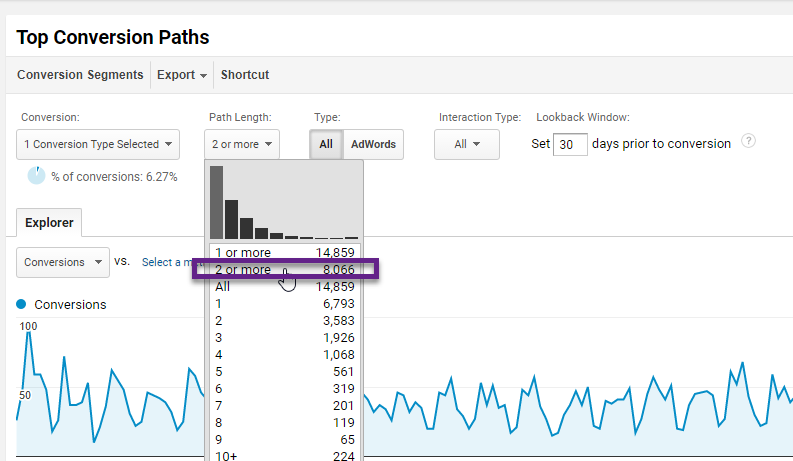
On default, “2 or more” is preselected.
Report 4: Time Lag
The Time Lag report is very interesting as well. It indicates how long it takes for conversions to occur relative to the first session of a visitor.
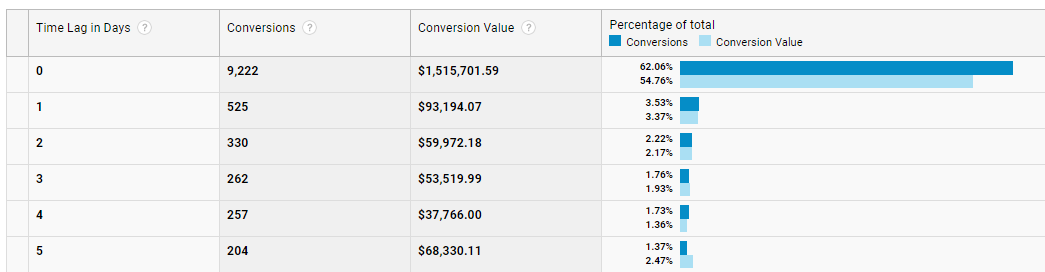 The conclusion is that 37.94% of all conversions take more than one day to occur.
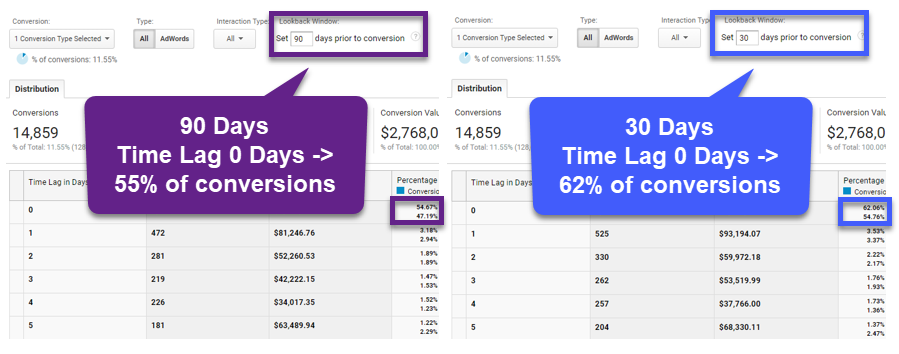
Keep in mind that a change in the Lookback Window affects the numbers. A longer Lookback Window (e.g. 90 instead of 30 days) leads to smaller number of conversions with a Time Lag of zero days and vice versa.
Report 5: Path Length
The Top Conversion Paths shows the actual channels that drive a conversion. In addition, the Path Length report provides an easy overview of path length compared to conversion.
Take a look below:
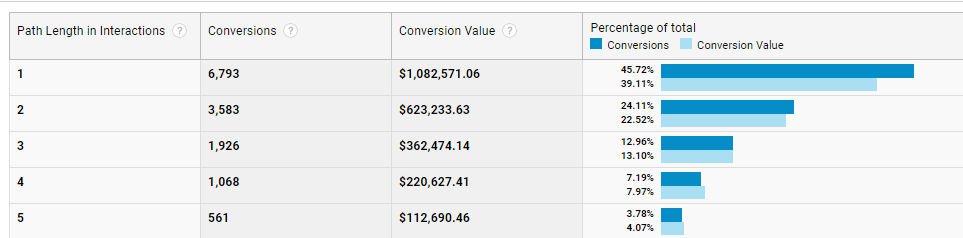
Slightly less than 50% of all conversions happen in one session.
Again, please note that these reports don’t take into account the effects of cookie deletion, cross-browser and cross-device performance. It is to be expected that the “real” numbers for Path Length = 1 are a bit lower. This all depends on the type of business and market you are in.
Channel Groupings in MCF Reports
In many earlier articles I have stressed the importance of accurate campaign tagging and channel definitions.
There is a pre-defined default channel grouping used in the MCF reports called the Basic Channel Grouping. This grouping provides many actionable insights into the conversion process.
However, if you are like me you want to get the best insights out of your data. And you don’t settle for less than that!
This is when you want to modify the default channel grouping and create custom channel groupings for your analysis.
You can create your Custom Channel Grouping from scratch in the admin interface or you start in the reporting interface:
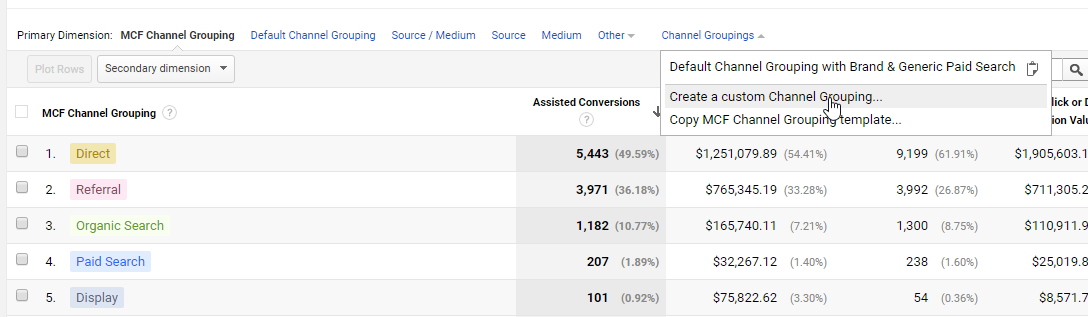
It might be most easy for you to work from (copy) an existing template.
Here are some quick tips:
- Copy the MCF Channel Grouping template and start from there.
- First set up a high-level overview Custom Channel Grouping.
- Second, you can set up a detailed Custom Channel Group as well if your numbers per channel are high enough.
At the time of writing you can’t use a custom channel group via the Reporting API. This is where you are limited to work with the default channel group (which can be modified as well).
MCF Segments
Segmentation is key in getting actionable insights from your data.
I recommend to read these articles if you are unfamiliar with segmentation in general:
- Beginners Guide to Google Analytics Segments.
- Sequence-Based Segments in Google Analytics.
- Ultimate Guide to Regular Expressions.
Multi-Channel Funnel segments are unique and can only be applied to the MCF reports.
You have default segments and the option to create your own segments.
Tip: try out a few default segments first to learn how they work.
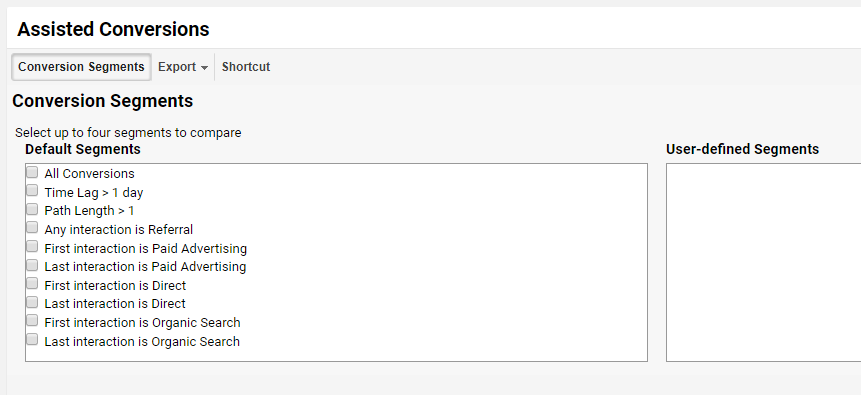
User-Defined Segments
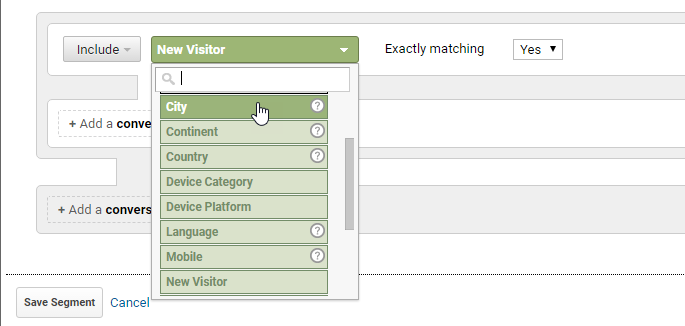
Creating your own segments is very effective. The segments you want to apply are unique to your business and the conversion related questions that you might have.
Here is an example: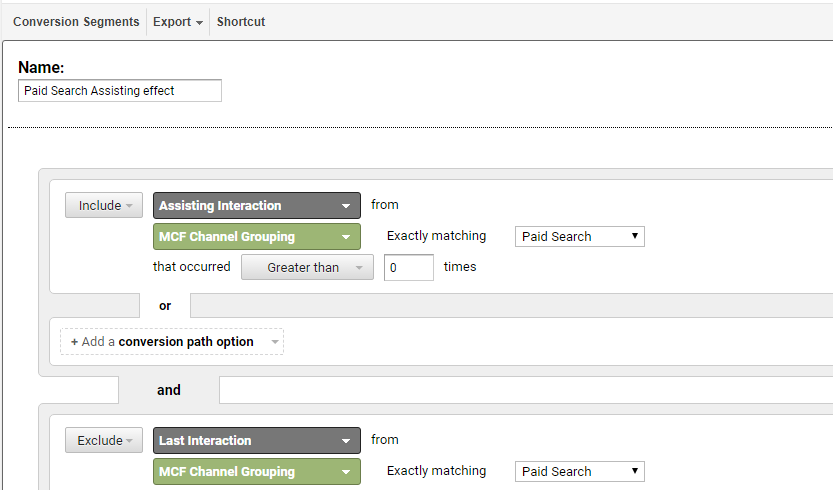
This segment returns data of the impact of paid search on conversions in other channels. Remove all conversions where paid search was the last touchpoint.
And this is the actual data:
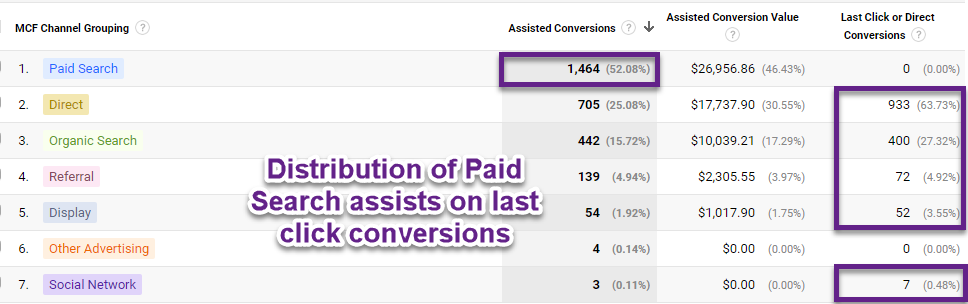
This is just the tip of the iceberg! Next step would be to split between brand and generic queries and to find out how channels interact with each other.
We’ll dive more into analysis and optimization with Multi-Channel Funnels in the next chapter.
MCF Analysis and Optimization
By now you’ll have a basic understanding of the terminology and reports related to Multi-Channel Funnels.
It’s time to share some actionable examples that you can apply to your business and data.
Let’s assume your are running Paid Search campaigns on your website and you want to answer the following questions:
- How much does Paid Search interact with other marketing channels?
- Is Paid Search an initiating or closing channel?
- Are branded campaigns closing a lot of conversions?
I’ll answer them one-by-one.
Case study:
- Three months of data.
- Large, International Ecommerce Store.
- Lookback Window 30 days and 90 days.
Case 1: Paid Search Interaction
Here is how to get the required data.
Step 1: navigate to Conversions >> Multi-Channel Funnels >> Overview.
Step 2: select to only include Transactions.
Step 3: select Direct, Paid Search and Organic Search.
Step 4: compare data for Lookback Window of 30 days vs 90 days.
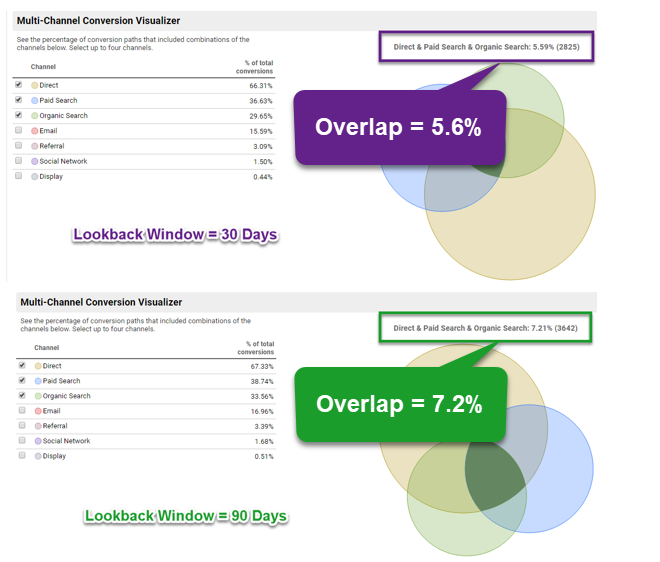
As expected, increasing the Lookback Window leads to a larger conversion channel overlap -> more channels are involved with the same transaction. In this case Paid Search is not very dominant. Usually, high-involvement purchases show a higher overlap than low-involvement purchases. Knowing how channels influence each other helps you to decide how to best spend your budget.
Case 2: Paid Search: Assisting or Closing?
It’s important to not only take note of closing revenue, but also assisting revenue metrics.
In this case we’ll only look into a Lookback Window of 90 days.
Step 1: navigate to Conversions >> Multi-Channel Funnels >> Assisted Conversions.
Step 2: analyze data of Paid Search.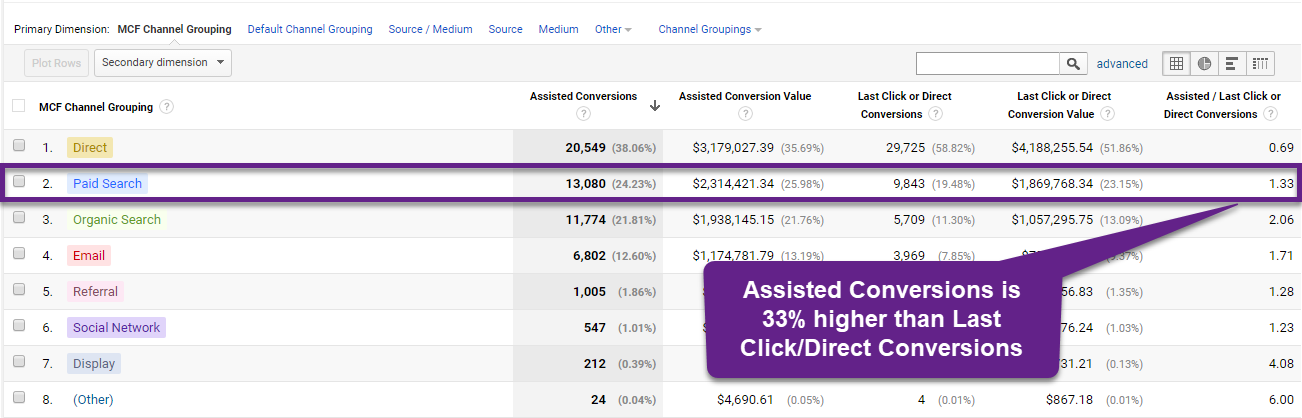
It turns out that Paid Search is good for 33% more assisted conversions if compared to last click conversions. It’s clear that Paid Search has a mixed role: assisting and closing. Keep in mind that the above picture treats Direct the same as all other traffic channels. For you, it’s important to find out whether you need Paid Search to close certain transactions. This is when the role of Branded vs Generic Search get’s important.
Case 3: Branded Campaigns, Overvalued?
In Google AdWords, your branded campaigns very often show spectacular results. But how often do branded campaigns take the credits of another initiating channel?
There are many different ways on how you can analyze these effects.
Here are three examples of how to approach this:
- Analyze the results of the Assisted Conversions report. You can split your Paid Search in branded and generic Paid Search campaigns. This allows you to compare the assisting/last click ratios for different traffic channels.
- Focus on AdWords type (instead of all channels) and analyze brand campaign performance in comparison to other campaigns and traffic channels.
- Examine the Top Conversion Paths for a closer look on how your AdWords brand campaigns perform. Do they close many transactions?
It’s important to know the roles of each of your campaigns and traffic channels. You will find out that some channels are great in creating the final sale and others spread brand awareness and initiate the conversion.
It’s all about finding the right mix of channels to boost your online business’ performance!
MCF Reporting API
Google Analytics comes with a ton of options to get (additional) data in and out of Google Analytics.
Most of you are probably already familiar with the core reporting API. This API allows you to get a bunch of metrics and dimensions out of Google Analytics (and avoiding to use the “export” functonality).
With the Multi-Channel Funnels Reporting API you can:
- Create custom reports using Multi-Channel Funnels data.
- Integrate Multi-Channel Funnels data with your business data, e.g. online conversion data and offline sales data.
- Display Multi-Channel Funnels in new environments, e.g. in Google Data Studio.
Here are three useful support links:
- Multi-Channel Funnels Reporting API – Developer Guide.
- API Explorer.
- Multi-Channel Funnels Metrics and Dimensions overview.
In addition, you can leverage tools like Supermetrics to extract data (in an easy way!) to Google Sheets:
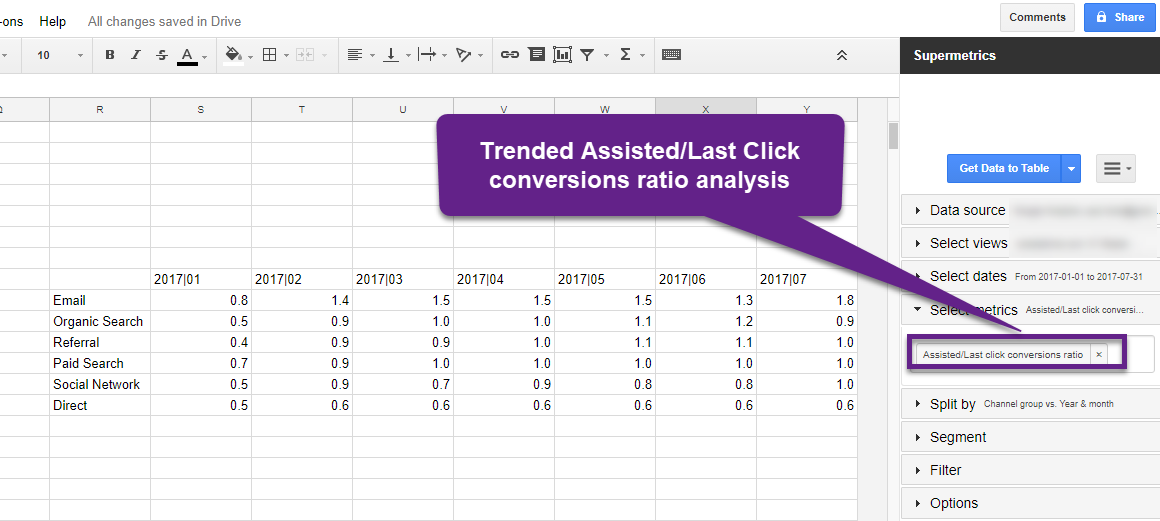
This is a big time saver if you want to perform in-depth Multi-Channel Funnel analysis.
MCF Challenges
The Multi-Channel Funnel reports can bring a ton of insights, but they have their challenges and limitations as well.
Let’s look into five of them.
1. Difference between Standard and MCF Reports
In the Multi-Channel Funnels reports, if direct traffic converts, the conversion is attributed to the Direct channel. This differs from other Analytics reports in which the conversion is attributed to the previous non-direct campaign or source, if there is one.
This can cause substantial differences in conversion attribution.
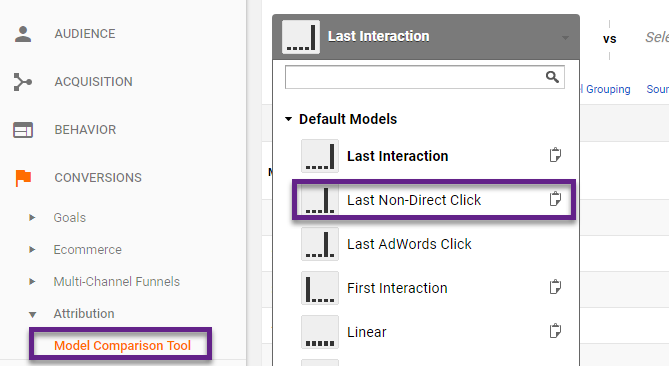
However, you can create similar results by using the Last Non-Direct Click attribution model.
2. Lookback Window of 90 Days Max
For some businesses and their sales cycle, a 90 days Lookback Window is still too short. However, in the past it was limited to 30 days so a big improvement here!
Working with custom dimensions, user IDs and specific views might provide you with a more holistic overview (across devices and browsers) but there are still limitations. User level segmentation is key if you want to analyze and optimize Multi Channel behavior!
3. Conversion Segments are Limited
Google could make big improvements by adding more options to the conversion segments. There are of ton of segmentation options for AdWords, but overall the options are lacking.
You have almost unlimited options with the regular segmentation feature in Google Analytics.
Three useful add-ons for conversion segmentation:
- Event segments.
- Custom dimension segments.
- (Landing) page segments.
I assume Google reads this too. ;-)
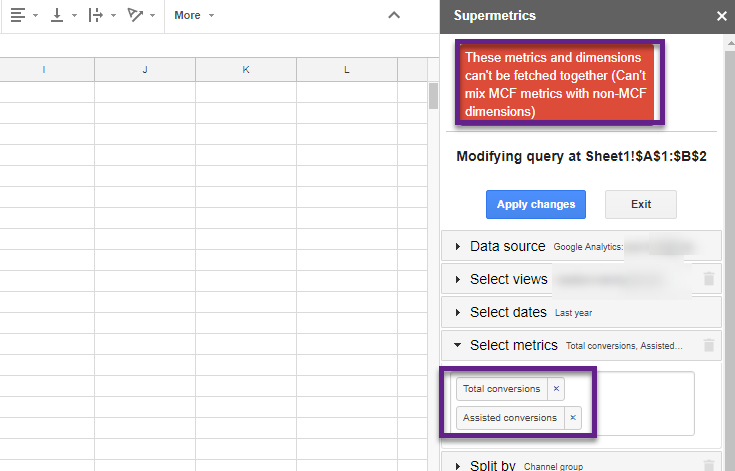
4. APIs don’t Work Together
You will have to come up with a (technical) workaround as you can’t properly combine metrics and dimensions from the Multi-Channel Funnels API with the Core Reporting API.
![MCF + Standard Reporting API]() 5. Non-Converters are Invisible
5. Non-Converters are Invisible
 5. Non-Converters are Invisible
A huge drawback of the Multi-Channel Reports is that it only takes into account converted paths.
You won’t learn anything here about the website visitors that didn’t convert in their journey(s).
Concluding Thoughts
The Multi-Channel Funnel reports are very useful although we have to deal with some (measurement) challenges.
These reports belong to the more advanced ones in Google Analytics. Make sure to educate yourself first on channel groupings, channel definitions and related topics before you dive into the MCF reports.
Another thing, especially important with attribution, define your business questions upfront!
What do you want to get out of these reports? What are you trying to optimize? The foundation of your analysis is crucial here.
I hope you have learned a lot of new things and I am happy to hear about your experience with the Multi-Channel Funnels in Google Analytics.
One last thing... Make sure to get my extensive checklist for your Google Analytics setup. It contains 50+ crucial things to take into account when setting up Google Analytics.Download My Google Analytics Setup Cheat Sheet
The post Complete Guide to Multi-Channel Funnels in Google Analytics appeared first on Online Metrics.