The Real-Time reporting features in Google Analytics allow your to monitor marketing efforts and test technical changes on your website. And they can be very effective!
The usefulness of these features is not limited to just marketers and analysts. IT departments, Customer Service and various other departments can use these reports to their advantage.
In this blogpost I share everything you need to know about the Real-Time reporting section in Google Analytics.
Table of Contents
- Overview of Real-Time Reports
- Drilling Down Techniques
- Real-Time App Reports
- Case 1: Monitor Important Campaigns
- Case 2: Troubleshoot UTM Tracking
- Case 3: Test GA Tracking Code
- Case 4: Monitor Goal Completions
- Case 5: Test New Filters
- Case 6: Impress Your Client
- Real-Time Reporting API
- Limitations
Overview of Real-Time Reports
Since its existence, the Real-Time reports section in Google Analytics has been updated quite a few times.
Currently the reporting section consists of several reports which are described below.
Overview
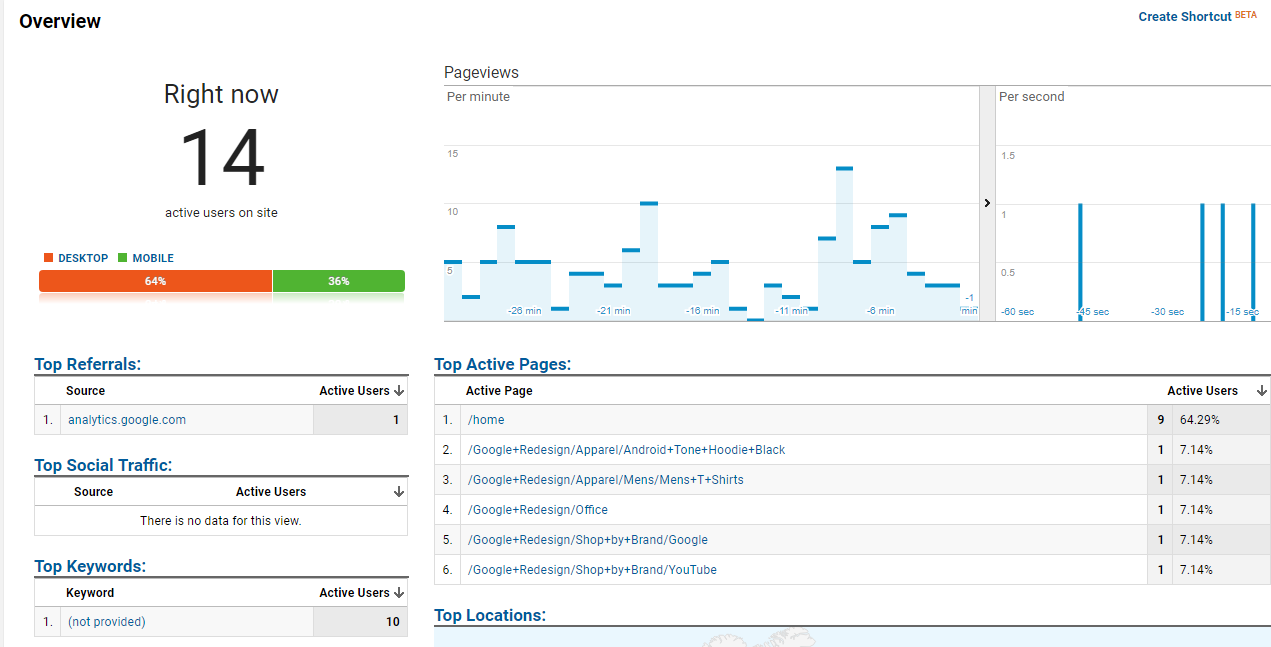
The Overview section shows what’s currently going on on your website.
It shows how many users are on your website, what the top referrals and social traffic sources are and which pages are popular at any given moment. Further you can review the distribution of pageviews in the last 30 minutes.
![Real-Time overview]() Location
Location
 Location
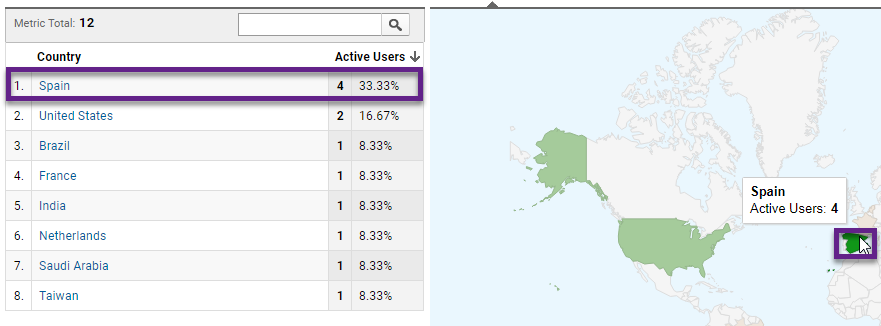
This report is useful if you are interested in learning where visitors come from at any given moment.
You can filter / zoom in at any specific country by clicking on the country name in the table or on the map.
![Real-Time location]() Traffic Sources
Traffic Sources
 Traffic Sources
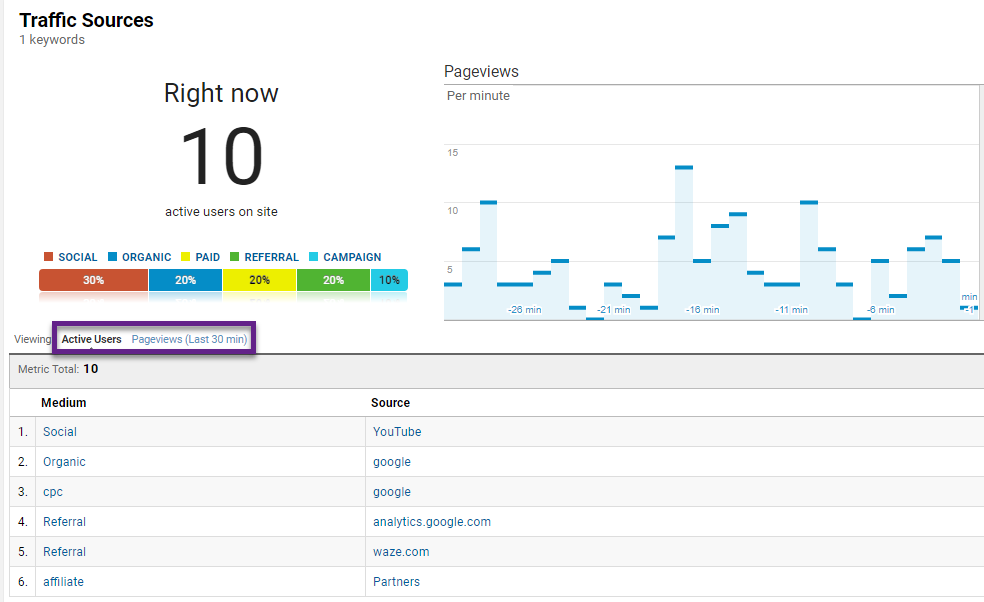
The traffic sources overview can tell you which mediums and sources are most popular at the moment. And you can review the same stats for the past 30 minutes. By clicking on a specific medium or source you can further drill down on the data.
Content
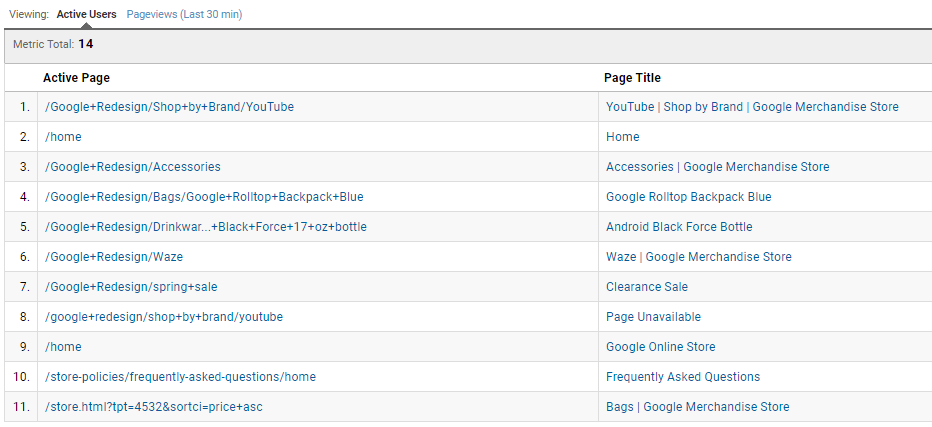
For a more in-depth overview of the content performance on your website, you can click on the Content tab.
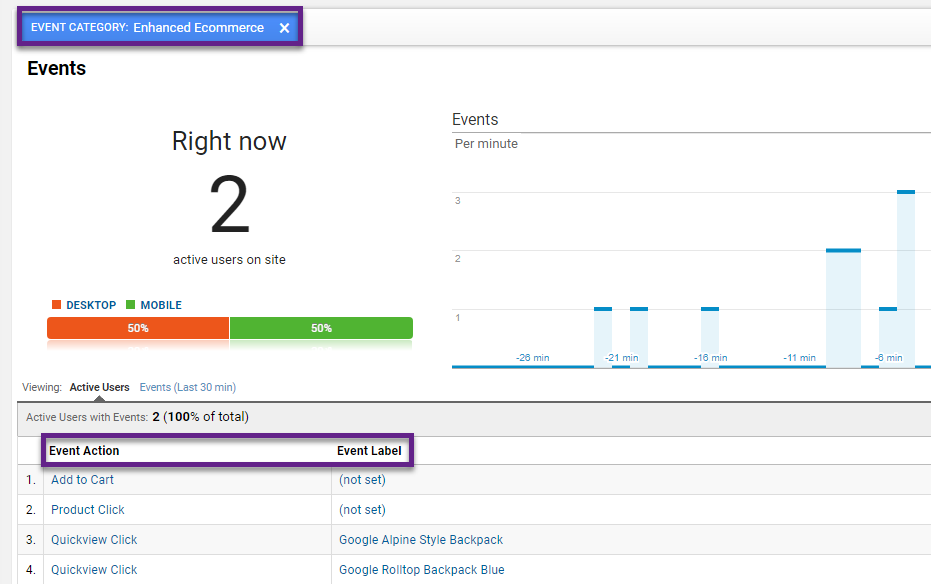
![Real-Time content]() Events
Events
 Events
Go to the Events section of the Real-Time reporting to see which events are fired now and in the past 30 minutes. “Event Label” is hidden on default, but you can retrieve the values by clicking on one of the “Event Categories”.
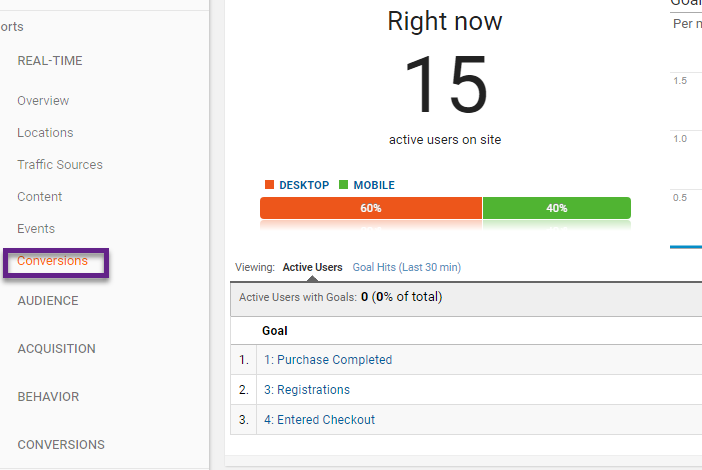
Conversions
The last section shows which Conversions are recently completed on your website.
It only shows goal conversions and doesn’t include transactional data. And it is limited to destination and event-based goals.
Drilling Down Techniques
There are different techniques on how to drill down on your Real-Time data.
1. Click on One Dimension
In this example I have clicked on country “Australia”.
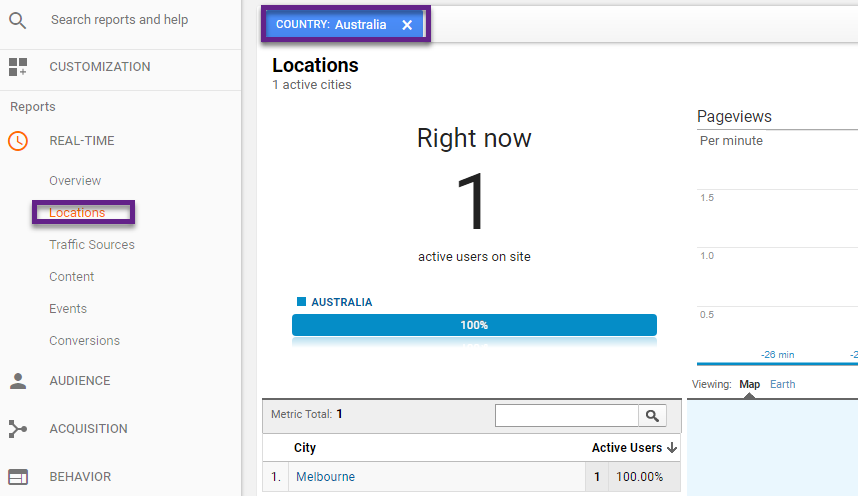
Especially for debugging purposes it can be extremely useful to combine multiple dimensions or criteria.
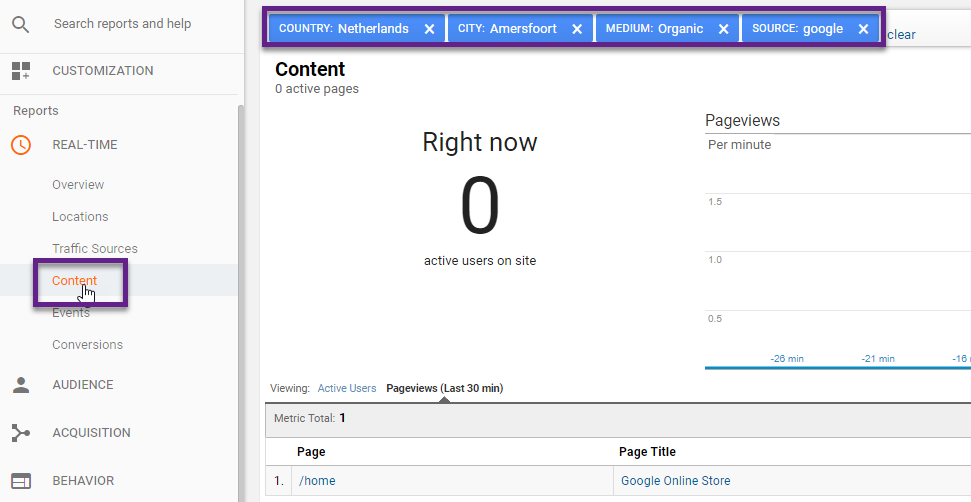
2. Combine Multiple Dimensions
I have just visited the Google Merchandise Site.
- Google / organic
- Visited homepage only
Within the Real-Time reporting section, I have first selected country “Netherlands” and city “Amersfoort”. After I drilled down on “Medium” and “Source”. After that I select the Content section. This is how it looks like:
 These techniques help you to quickly retrieve the data you need for your specific analysis.
Real-Time App Reports
Google Analytics also comes with a Real-Time section for properties where App data is collected.
This is how each of the sections look like (website and app):
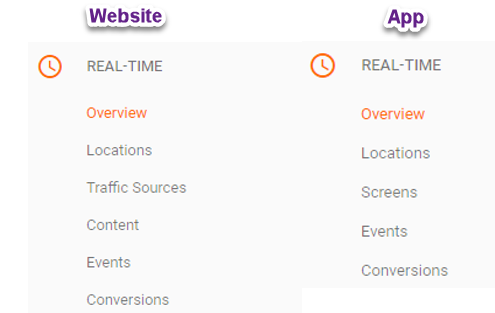
The App reports don’t show traffic sources and are focused on screens and App versions.
Both Real-Time report sections are in line with the rest of the reports in Google Analytics.
Quick tip: you can use the “Save Shortcut” link in the top right corner of your Real-Time report to save all settings applied to your report. After, they are visible under “Saved Reports” in the Customization section.
This was a quick introduction, let’s dive into the actionable examples!
Case 1: Monitor Important Campaigns
Most people analyze certain campaign data after a while and not directly after the launch.
But what if you run a very short, high traffic campaign? For example, a social campaign that draws in most visitors within just a few hours or days of launch.
Sometimes you want to modify something on your website – e.g. create extra content – based on how the website visitors react. In this case Real-Time reporting can be a great feature to use and gain insights very quickly. So that you can get the most out of this campaign.
Case 2: Troubleshoot UTM Tracking
UTM parameters lie at the heart of the Google Analytics tracking system. For a major part they control how each of your users is recognized in Google Analytics (source/medium).
There are a lot of things that could potentially break your UTM campaign tracking. One of them are redirects.
Or maybe you are about to send your first email campaign and you haven’t tested your UTM tracking yet. There are a ton of debugging tools available that can help you debug any tracking issues. One good way to get started is by monitoring your UTM tracking parameters in the Real-Time reports.
Quick tip: it’s recommend to filter your behavior within the Real-Time reports, e.g. by location. This helps you to more easily troubleshoot on any UTM parameter issues.
Case 3: Test GA Tracking Code
In general, if you deploy a new Google Analytics implementation hardcoded or via GTM, you want to ensure your GA tracking code is working properly.
With a Tag Manager implementation I recommend using the debugging features of the Tag Manager platform.
On the other hand – if you are still using hardcoded scripts, it might be very helpful to monitor your implementation directly in the Real-Time reporting interface.
Case 4: Monitor Goal Completions
Sometimes you might set up a new goal without being able to verify it before going live.
In that case – and especially when going through changes on your site – it is very helpful to keep an eye on the Real-Time reports in Google Analytics.
Case 5: Test New Filters
Google Analytics filters can be powerful if implemented correctly. That’s why I always recommend setting them up in a test view first.
You can use a specific debugging tool or navigate to the Real-Time reporting section to monitor the effect of an implemented filter on your data.
Especially if you want to quickly test an advanced filter this can be a handy method to follow!
I hope these examples get you started with working with the Google Analytics Real-Time reports.
Case 6: Impress Your Client
Great remark from Uros Djunisijevic – use Real Time reporting data to impress your client!
As you might know, many companies still not leverage features like Event Tracking. And simply look at plain, aggregated pageview data.
So go ahead, implement relevant events and impress your client with the blue vertical event tracking spikes! :-)
![]()
Real-Time Reporting API
By the time of writing, the Real-Time Reporting API is still in limited data.
- Display active viewers of a page and create a sense of urgency for users looking at an item with finite inventory.
- Display the most popular content such as the top 10 active pages.
- Create and display a real time dashboard.
Learn more about Real-Time and Google Data Studio:
Limitations
The Real-Time reports have their place in Google Analytics. Personally I use them most often for quick debugging and monitoring.
However, there are a few limitations you should be aware of:
- Google recommends using an unfiltered view as the effect of filters might not directly be visible. Of late, I haven’t seen issues when debugging filters in Real-Time.
- You may experience short delays in the Real-Time App reports because of batched hit processing. Use the Real-Time reports for a rough analysis instead of trying to measure the exact screens etc. in real-time.
- When analyzing referral counts in Real-Time you may sometimes notice a direct referral instead of a specific campaign (related to a specific session). Traffic and conversion are incorrectly correlated to the wrong source in the Real-Time reports and correctly shown in the standard reports. This is something Google is aware of and are solved in a future update. This usually happens when a user returns direct to a site after coming via a campaign source.
I think that if you are aware of the limitations, you can make the Real-Time reports useful in many ways! Do you use these reports and how?
One last thing... Make sure to get my extensive checklist for your Google Analytics setup. It contains 50+ crucial things to take into account when setting up Google Analytics.Download My Google Analytics Setup Cheat Sheet
The post How to Leverage Real-Time Reporting for Your Business appeared first on Online Metrics.