Your conversion rate is one of the most important metrics to keep an eye on. Unfortunately most companies calculate the Google Analytics conversion rate in the wrong way.
Setting up Google Analytics in the right way is much harder than you think. There are a ton of things that can go wrong!
A few weeks ago I published a 4.000+ words post on Google Analytics goals. Configuring a goal is pretty simple, but without a strategic approach and really thinking about your business first, your goals won’t make much sense. The same is true for the conversion rate. A relatively simple metric, but it becomes a deceiving metric for sure if you don’t know what you are exactly measuring.
This post will tell you everything about the Google Analytics conversion rate and outlines the steps to make this metric both reliable and actionable!
Table of Contents
- Why Conversion Rate is Important
- Default Calculation of Conversion Rate
- Three Suggestions to Improve This Metric
- Difference with Funnel Conversion Rate
- User Level Conversion Rate
- Concluding Thoughts
Why Conversion Rate is Important
No matter what business you are in. You can always define one or more actions that you want your website visitors to take.
The main conversion on your website is called the macro goal.
Here are a few examples:
- Content website: becoming a subscriber.
- Leadgeneration website: submitting a leadgen form.
- Ecommerce website: buying a product.
Three things that are very important here:
- Conversion rate: the percentage of website visitors that take a desired action.
- Initial value: the initial value that a client brings to your organization.
- Lifetime value: the lifetime value that a client brings to your organization.
Maximizing the value for your company requires that a decent amount of your website visitors becomes a client.
That’s when the conversion rate becomes an important metric to monitor and optimize.
Default Calculation of Conversion Rate
On default, the conversion rate in Google Analytics is based on all goals that you have set up. This is where this metric can already cause problems.
An example:
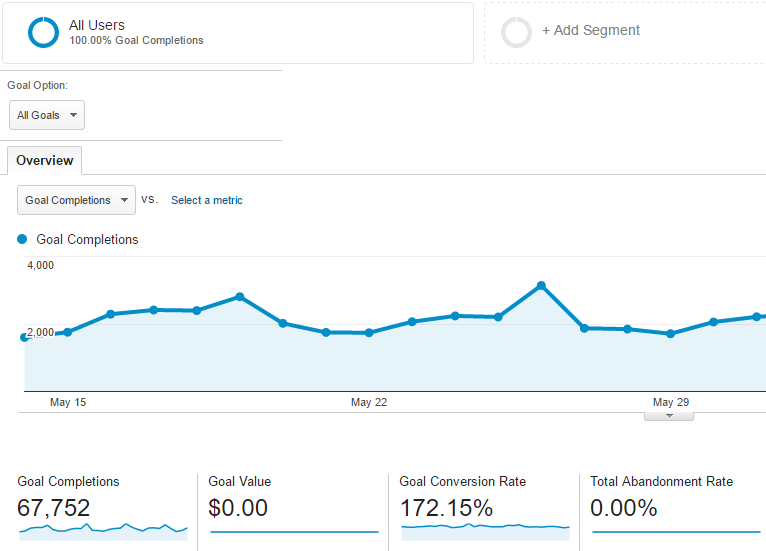 A goal conversion rate that is higher than 100% doesn’t make a lot of sense.
That’s why you need to be very careful when setting up goals in your view.
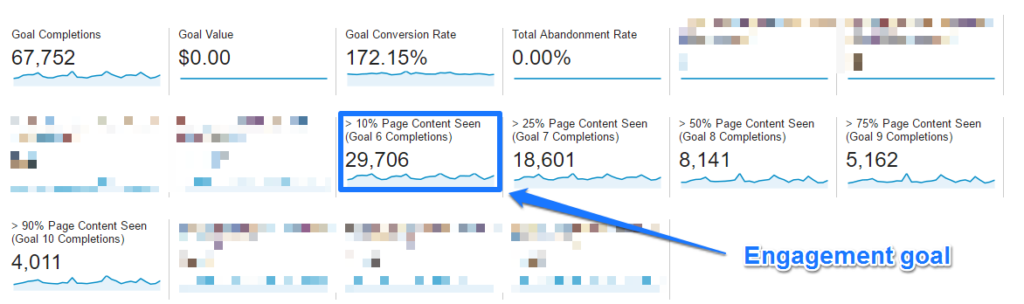 Measuring “engagement” metrics can be worthwhile, but don’t include them as a goal in your main reporting view. Your overall conversion rate will become highly inflated and is of no use anymore.
Overall converion rate is calculated as:
Total number of Goal Completions / Total number of Sessions
And remember that a goal is only measured one time in session.
Peter visits your ecommerce thank you page two times in a session. The ecommerce thank you page is set up as a goal in Google Analytics. Although he visits this page twice, it is still registered as one goal. In comparison, Google Analytics will measure two transactions.
Individual Goal Conversion Rate
Analyzing and optimizing on an individual goal can be worthwhile, but it all depends on the goal that you have defined. I will explain this based on two scenarios.
Scenario 1
These numbers belong to the same website as shown in the prior example.
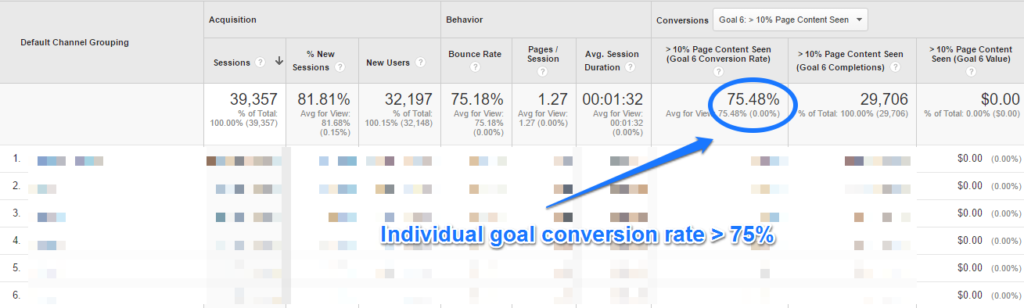 How can you ever optimize on this particular goal? It’s ok to measure page consumption stats with event tracking, but you should refrain from setting this up as a goal in your main reporting view. Would you act different if the number goes up or down? It’s impossible to make this an actionable metric.
Scenario 2
These numbers belong to a website that is selling tickets online.
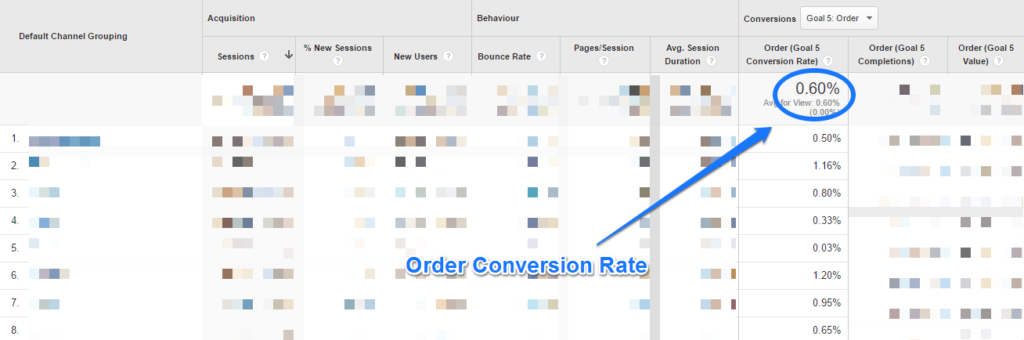 Now we are getting somewhere. The value of 0,60% makes sense and you have the option to cross-segment it on the channel level or to examine it per landing page or on any other dimension of your choice.
Three Suggestions to Improve this Metric
The exacts steps you need to follow depend on your unique situation.
I will describe three things that might help you to get more reliable conversion rate numbers.
1. Filter out Internal IP Addresses
On default, Google Analytics measures all traffic that is sent to your website.
This means that your conversion rate is influenced by internal website behavior. In general this has an impact on two levels:
- Your conversion rate is lower than it should be (normally you don’t convert on your website, or you are running some tests)
- The relative conversion rate on specific dimensions will be influenced. You will probably visit the website via the same medium today and tomorrow.
That’s why I highly recommend to set up IP filters on your main reporting view. Read all about setting up filters in this extensive filters guide.
Ghostery will help you out in case you have a dynamic IP address.
 This additional resource from LunaMetrics is very helpful if you want to learn more about identifying and filtering internal traffic.
2. Filter out Existing Clients
Your website visitors consist of people that never buy, people that might buy and people that already bought from you.
It’s hard to identify the people that never buy upfront. However, you probably know which people converted in the past.
This is very important for websites that have a (relatively) large client base and a login environment. You want to calculate the conversion rate excluding your clients (if they have a very low or no chance) to convert again.
Segmentation is crucial here. You need to come up with an identifier so that you can exclude these buyers. Your conversion rate will become a much more reliable metric to further optimize.
I recommend to start with setting up simple segments (e.g. on the login page) and transition to using custom dimensions.
Setting up these custom dimensions can be very valuable even if you run an ecommerce store where your clients buy more often. However, don’t filter them out when calculating the conversion rate.
3. Filter out Specific Regions or Countries
This is especially important if you do business in one or a few countries. It doesn’t make sense to include visitors (and their conversion rate) in your analysis, if these people can’t read or convert on your website.
When this is the case, I recommend to set up an extra view where you include specific regions that you target for your product or service.
I can’t tell you which regions you should include. It depends on your focus and who your target audience is.
Note: you don’t have to worry about this if you sell internationally and in potential every website visitor could convert.
Difference with Funnel Conversion Rate
Google Analytics allows you to set up a funnel which reveals another metric: funnel conversion rate.
The funnel conversion rate is calculated based on how many visitors enter your funnel and how many of them eventually convert. This in conjunction to the normal conversion rate which is based on all sessions.
There is one more thing you should know. In Google Analytics you can make the first step of your goal funnel a required step.
Keep in mind that selecting the first funnel step as required only affects the funnel conversion rate report. The goal conversion of someone who didn’t hit step one is still counted in all other Google Analytics reports.
User Level Conversion Rate
Although users will never be a perfect metric for every website, I still want you to take one more step.
By now you know the importance of setting up useful goals and using filters. But like I mentioned in the beginning, the conversion rate is calculated based on number of sessions. I like you to think in terms of users instead of sessions.
You might be lucky that you have implemented the User ID feature on your website, but in any case this is a useful last step.
Here is an example (based on an ecommerce website):
- Pete visits your website on May 1st and views three product pages.
- Pete comes back on May 5th and adds one product to his basket but doesn’t convert.
- Pete comes back on May 8th and adds two products to his basket but doesn’t convert.
- Pete comes back on May 12th and buys four products.
On default, Google Analytics measures a session based conversion rate of 25,00%. This number is skewed since Pete is one person.
We can recognize Pete as ONE user if he visits your website four times via the same browser and device. The user based conversion rate equals 100% in this case.
Let’s face it, you will never get 100% accurate numbers, but do your best to get the best metrics possible!
I want you to think about a set of user based conversion metrics that work best for you.
Here is an example of a simple calculated metric (user based conversion rate):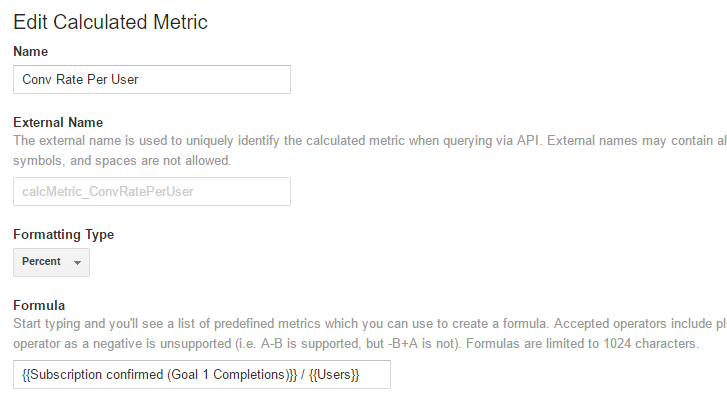 And the corresponding custom report:
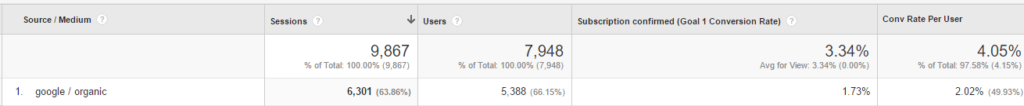
As you can see, the user based conversion rate for organic search is 20% higher than the session based conversion rate.
Concluding Thoughts
- I recommend to use the conversion rate metric as part of your optimization efforts.
- Be sure to only measure highly relevant goals to make sense of this metric.
- Modify the calculation by excluding your own IP address (and from other known parties).
- Add extra filters (e.g. to filter clients) if applicable in your situation.
- Use calculated conversion rate metrics (e.g. user level conversion rate) as well and compare them to session based metrics to get the best understanding about how you perform.
How do you approach the conversion rate metric as part of your optimization efforts? I am happy to hear your thoughts!
One last thing... Make sure to get my extensive checklist for your Google Analytics setup. It contains 50+ crucial things to take into account when setting up Google Analytics.Download My Google Analytics Setup Cheat Sheet
The post The Secrets Behind Google Analytics Conversion Rate appeared first on Online Metrics.