Custom reports are very powerful, but only useful and accurate if you combine the right set of metrics and dimensions. The flexibility that Google Analytics offers is great, but can lead to confusing custom report data.
Google Analytics allows you to combine hundreds of different metrics and dimensions to set up a report that exactly matches your needs.
Getting real actionable insights starts with setting up Google Analytics and your reports in the right way.
In this article I will reveal one of the most common mistakes and how you can easily avoid falling in this trap.
Custom Report Example
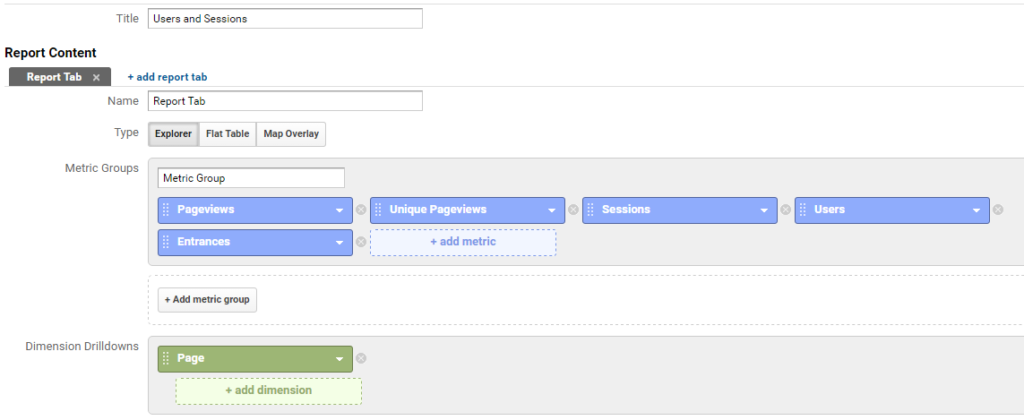
Here is an example setup of a custom report in Google Analytics:
Let’s take a look at the corresponding data:
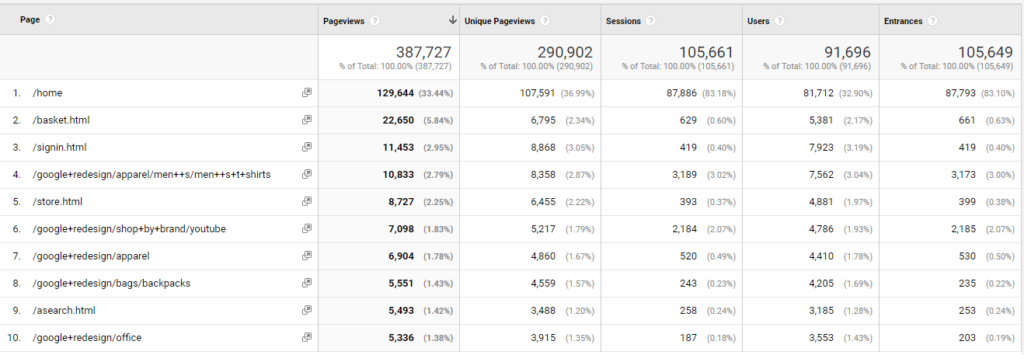
Here are a few things you might have noticed as well:
- Total number of sessions is higher than total number of users.
- For individual pages the total number of sessions is lower than the total number of users (the homepage is an exception).
- The total number of sessions doesn’t equal the total number of entrances (minor difference).
So a question that I often got asked is:
“Why are the number of users that see this page higher than the number of sessions?”
Let’s dive into it a bit deeper…
Dimension Scope
As a first step you need to understand the different scopes of a dimension in Google Analytics.
There are three different dimension scopes you should know about:
- Hit level dimension
- Session level dimension
- User level dimension
Actually, there is a fourth one: product level dimension. We won’t elaborate on the last one today, since it is not relevant here.
Hit Level Dimension
A hit level dimension refers to a dimension that can have a different value for each subsequent hit on your website.
Here are three “hit” level dimension examples:
- Page
- Page title
- Page path level 1
Session Level Dimension
A session level dimension refers to a dimension that won’t change for each subsequent hit within a session. You might visit three different pages, but the dimension value doesn’t change.
Here are three “session” level dimension examples:
- Source
- Medium
- Keyword
User Level Dimension
A user level dimension refers to a dimension that won’t change for each subsequent hit and session. You might have three different sessions within a week and visit dozens of page, but the dimension value doesn’t change.
Here are three “user” level dimension examples:
- Age
- Gender
- In-Market Segment
Invalid Dimension-Metric Combination
By now you know that Google Analytics captures “Page” as a hit level dimension.
This is the exact reason of the problem you have encountered.
- “Page” and “Sessions” is an invalid dimension-metric combination because both the dimension and metric have a different scope. The dimension “page” has a hit level scope combined with the “sessions” metric.
- “Page” and “Users” is an invalid dimension-metric combination because both the dimension and metric have a different scope. The dimension ‘page’ has a hit level scope combined with the “users” metric.
Ok, we now know that we have set up a custom report without taking into account that the dimension and metric scope should match.
I strongly recommend to bookmark the complete guide of metrics and dimensions to learn more about valid metric and dimension combinations.
Different Metrics in Relation to Page Level Dimension
But how does Google interpret pageviews, unique pageviews, sessions, users and entrances on a hit level dimension?
Besides knowing that the setup is wrong, it’s important to know the exact reason why this is as well.
Let’s assume we have two users that come to our site in November 2016. The users are Bob and Bobby.
Bob (one session)
- First session: Homepage >> About Us >> Privacy >> Homepage
Bobby (one session)
- First session: About Us >> Privacy >> Homepage
This is how Google Analytics would calculate the different metrics for the “page” level dimension:

- Pageviews: number of times each page is visited.
- Unique pageviews: number of sessions in which a particular page is visited.
- *Sessions: number of sessions in which this page was the first hit (including events).
- Users: number of users that are associated with a particular page.
- *Entrances: number of sessions in which this page was the first hit (excluding events).
Sessions
As you can see the “sessions” metric is incremented (and only associated with) the first hit of the session.
In short, you should use the “unique pageviews” metric if you want to know in how many sessions a particular page was viewed.
In addition, a very interesting (calculated) metric to review is:
Total number of pageviews / total number of unique pageviews
This will give you an insight in how often a particular page is visited in a session.
For example, a high ratio on this metric for ecommerce funnel steps combined with a low ecommerce conversion rate might indicate a usability issue. This since a lot of people are going back and forth, but are not ordering your products. Sequential segments are very useful here to investigate things at a deeper level.
Entrances
Entrances are very close to the number of sessions. In our earlier example we saw:
- 105661 sessions
- 105649 entrances
This is an absolute difference of 12 and relative difference of 0,01%, so not an issue.
The reason why is that for the “session” metric the counter is incremented for events as a first hit. This doesn’t happen for the “entrances” metric which doesn’t take events on the first hit into account.
Make sure to review your implementation if you see a large difference between sessions and entrances. There might be an issue with events firing instead of pageviews on a popular entry point on your site.
Concluding Thoughts
The issue outlined in this post won’t occur if you stick to using the default reports in Google Analytics.
However, I strongly recommend to use the “custom reports” feature. Just keep in mind that you should be careful and only combine the right metrics and dimension to not mess up your custom report data.
Secondary dimensions are another powerful feature that can help you segment and access the right data for actionable insights. Once again, make sure to only add dimensions that fit the scope of your metrics.
The same counts for when you are exporting Google Analytics data via the API and build your reports and dashboards in another application.
Google Analytics is a very powerful tool, but knowing it’s foundation and how the metrics and dimensions are calculated is a must if you want to improve your business success! I hope you’ve learned a few new things again.
Don’t forget to share this post and leave a comment if you have anything to add or ask!
One last thing... Make sure to get my extensive checklist for your Google Analytics setup. It contains 50+ crucial things to take into account when setting up Google Analytics.Download My Google Analytics Setup Cheat Sheet
The post How to Avoid Common Pitfalls When Analyzing Custom Report Data appeared first on Online Metrics.