Measuring and optimizing the effectiveness of your content can yield great results. This post provides an actional framework around content analytics that you can directly apply to your business.
The content on your website plays a crucial role in the decision of people to do business with you or not. This is not limited to ecommerce or leadgen sites, but applies to all different “website types” on the web.
Every website consists of a huge number of different content blocks accessible from different pages on the website.
In this post I will reveal an in-depth strategy to use Google Analytics as the crucial driver for Content Analytics insights. It’s primarily aimed at Ecommerce Businesses, but the insights can be applied to any website or business on the web.
The information presented in the rest of this article will help you:
- Create a high-level overview of the content performance on your website.
- Research how people navigate through different content types on your site.
- Learn where most people enter and exit your website.
- Define a CRO strategy based on content worth.
- Gather a ton of extra insights your can use to optimize your business.
Table of Contents
- Content Analytics Challenge
- Set up (Enhanced) Ecommerce
- Transform Your Dataset
- Set up Content Groups
- Leverage Page Value Metric
- User Journey Analysis
- Content Group Segmentation
- Framework for CRO
Content Analytics Challenge
Having worked with dozens of midsize to large Ecommerce businesses, I can say that many of them share one big challenge:
“Google Analytics registers ten thousands or even more “different” pages on default.”
The larger the Ecommerce business, the more different products (and URLs) are usually available.
And even more importantly, these pages are not really “different”, but seen as different because of many different query parameters in the URL.
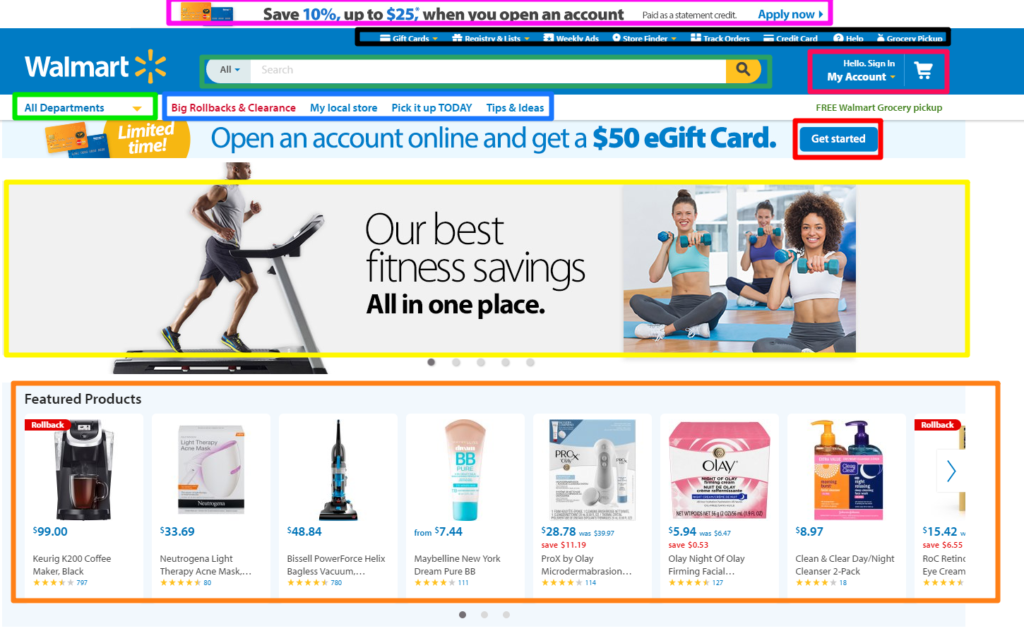
To illustrate, here is a product detail page (PDP) on Walmart.com:
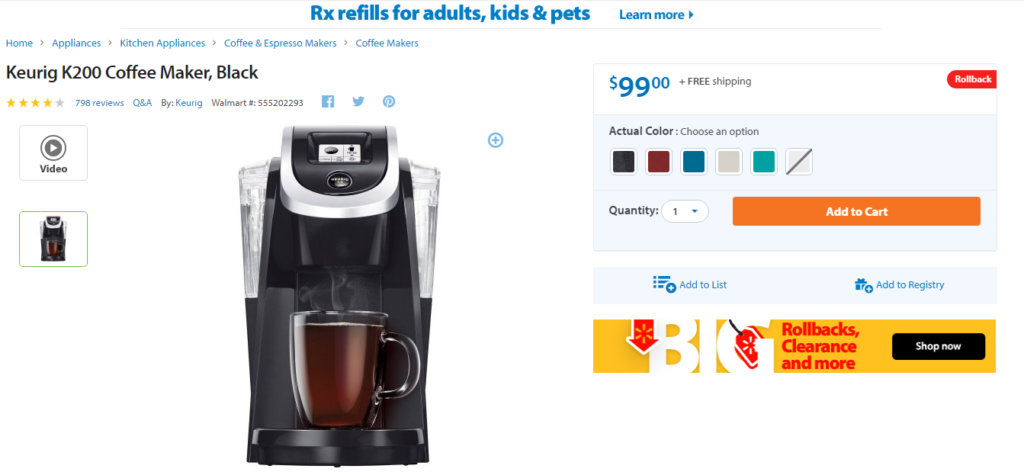
This PDP of a coffee maker carries this URL:
https://www.walmart.com/ip/49574596?findingMethod=wpa&tgtp=2&cmp=-1&relRank=0&pt=hp&adgrp=-1&plmt=1145x345_B-C-OG_TI_1-20_HL-MID-HP&wpa_qs=lmv2WNvQau4KBBghkhyiWxI63VTzhHE5pdpL7diphp8&bkt=1776976730&pgid=0&itemId=49574596&relUUID=87ac48ae-14dc-41f9-a60b-4ba266da6696&adUid=2527495a-8ddc-42f3-8830-9d44d4a571e9&adiuuid=dcd472e5-8776-4cf6-a2e5-7bd664b8419e&adpgm=hl&pltfm=desktop
A closer look reveals:
- Base URL = https://www.walmart.com/ip/49574596
- Query parameters:
- findingMethod=wpa
- tgtp=2
- cmp=-1
- relRank=0
- pt=hp
- adgrp=-1
- plmt=1145x345_B-C-OG_TI_1-20_HL-MID-HP
- wpa_qs=lmv2WNvQau4KBBghkhyiWxI63VTzhHE5pdpL7diphp8
- bkt=1776976730
- pgid=0
- itemId=49574596
- relUUID=87ac48ae-14dc-41f9-a60b-4ba266da6696
- adUid=2527495a-8ddc-42f3-8830-9d44d4a571e9
- adiuuid=dcd472e5-8776-4cf6-a2e5-7bd664b8419e
- adpgm=hl
- pltfm=desktop
A non-modified Google Analytics implementation and configuration would collect all those query parameters in Google Analytics. You can imagine how many “different” variations of the same PDP will be stored in GA.
Here is an extreme example of a Google Analytics account and view where no query parameters are removed:
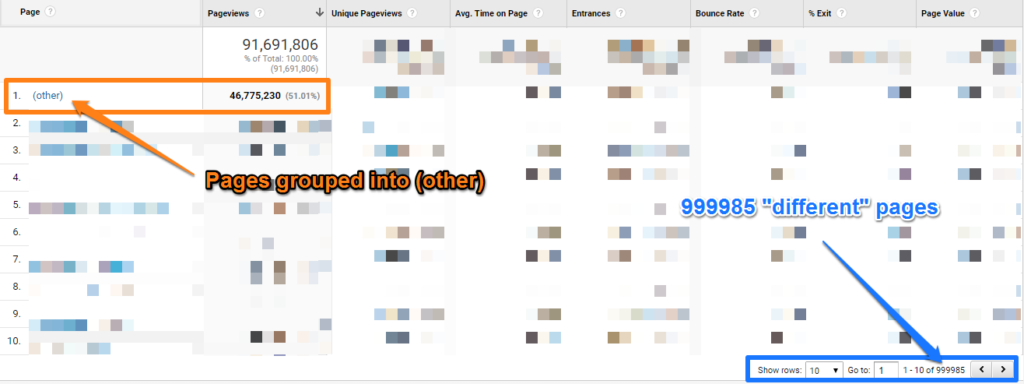
First Issue
This group (other) consists of a ton of different pages that cannot be explored on the surface of Google Analytics. Simply caused by having more than 100K “different” pages in the selected time period.
I recommend to read this article to learn more about rolled-up data in high-cardinality dimensions. It can appear in other dimensions as well, but it is usually not widely visible.
Second Issue
Besides having to deal with this rolled-up data reporting, how could you ever make a serious content analysis? It is impossible to determine the value of your pages and/or how people navigate through your sites.
Tools like Supermetrics and Excel could help you to aggregate content and make it more useful, but why not try to make your data already useful in Google Analytics? So that the data becomes more accessible to the masses.
Set up (Enhanced) Ecommerce
I would like to shortly touch upon Ecommerce in Google Analytics before diving deeper into the content reports.
Implementing transaction tracking via (Enhanced) Ecommerce is one of the prerequisites of better understanding and optimizing your content. I will share more on this later in this article.
A few weeks ago I published an article covering a ton of best practices and tips on setting up Enhanced Ecommerce. You should read it if you haven’t yet!
Note:
I recommend to refrain from setting up goal values in the Ecommerce view for content optimization. This is due to the nature of how Google Analytics calculates certain metrics.
Transform Your Dataset
By now you should understand the difficulties with storing a ton of (technical) query parameters in Google Analytics.
And I hope you are up and running with Ecommerce (transaction tracking) as well.
Here are three rules on a how to transform your Google Analytics Dataset and query parameters:
1. Set up Different Reporting Views
Google Analytics allows you to set up 25 different views in each Analytics property.
Any company should set up at least three views for their website (usually more):
- Raw Data view (no filters or other data modifications are applied)
- Master View (view than contains filters and other data modifications)
- Test View (view where you test all of your filters and data modifications first)
You could also set up a “clone” of your master view that doesn’t store any query parameter in the view.
Read my guest post on setting up multiple reporting views to learn more.
In addition, don’t forget to read these guides if you are not fully familiar with these topics:
- Ultimate Guide to Using Google Analytics Filters
- Ultimate Guide to Regular Expressions in Google Analytics
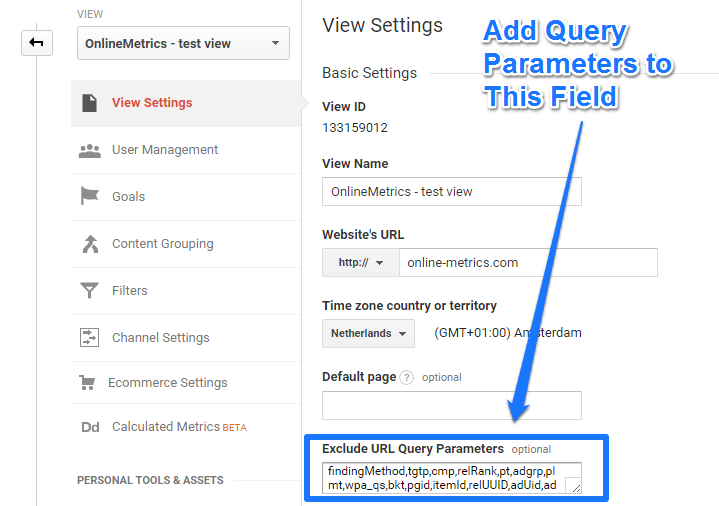
2. Modify Google Analytics View Settings
I like to divide the query parameters in two groups:
- Technical query parameters: these parameters don’t provide useful input for your data analysis and optimization efforts. Usually you want to get rid of (most of) them and they don’t make a page unique.
- Marketing query parameters: these parameters are useful in your analysis and optimization efforts. You don’t want to remove them. Usually each query parameter makes the content that a website visitor sees unique.
Let’s take the example of Walmart.com and that you want to get rid of a bunch of those parameters:
Keep in mind:
- You might need to work together with your developers to get a complete list of all the query parameters on your site.
- You can use the URL Parameters tool to indicate the purpose of the parameters you use on your site to Google.
Especially for smaller sites – that contain dozens instead of hundreds of different query parameters – this can be a pretty solid solution.
3. Use One or More Filters
Last, but not least is the effective usage of view filters in Google Analytics.
I will describe two different scenarios and which filter(s) to apply.
1. No Query Parameter Information is Needed
This is the most easy situation. You can remove all query parameters with the filter shown below:
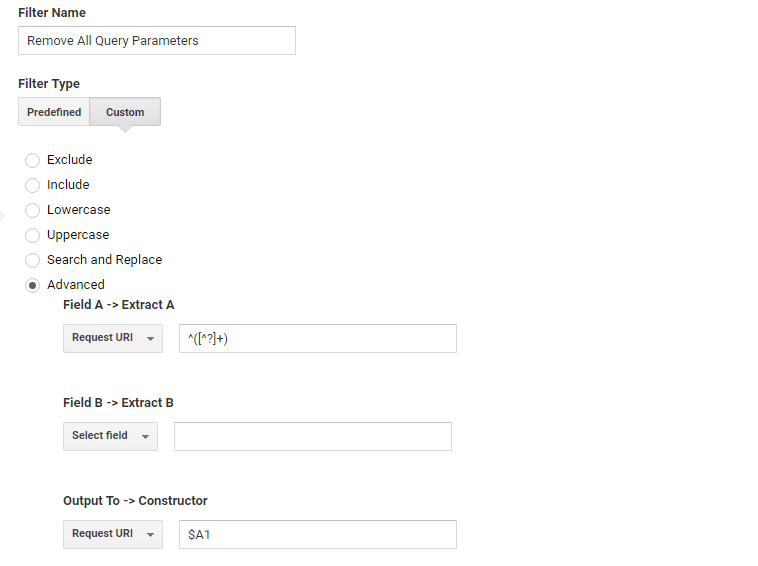 Applying this filter will result in removing all query parameters from the All Pages content reports in Google Analytics.
So be very cautious when applying this filter and I recommend to not apply it to all of your views of course. And make sure to test it first before you apply it to your master view.
2. One Query Parameter is Extremely Useful
This workaround can be applied to one or more useful query parameters that you don’t want to filter.
An example:
Your website consists of two types of PDP pages:
- Normal PDP page
- PDP page shown in a popup
A marketer would probably want to know and optimize the effectiveness of both pages.
But what if the PDP page shown in a popup is captured with a virtual pageview that contains a query parameter?
In that case you can still apply the filter shown above, but you need to apply a different filter first.
“Filter order in Google Analytics is extremely important as this will affect the actual working of all filters applied to a specific view.”
Let’s assume that the query parameter is pdp and the value is popup when a pdp page is loaded in a popup. In addition this query parameter is always shown at the end of a URL. Here we go:
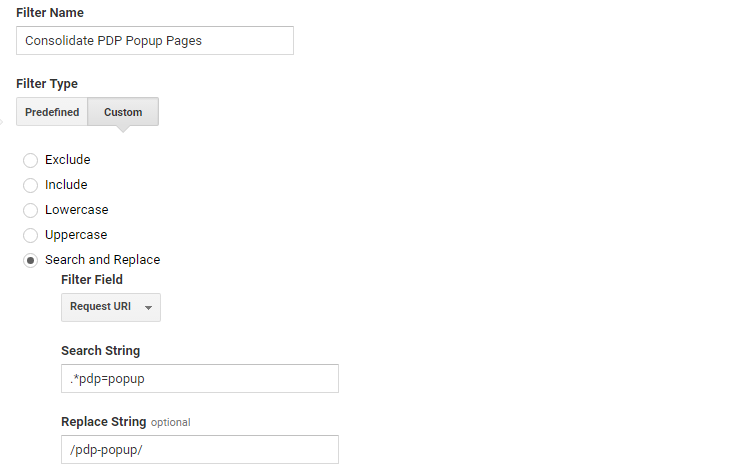
By applying this filter before removing all query parameters:
- You will create an aggregated pageview of all pdp popup views.
- You can still analyze and compare the effectiveness against the general PDP page.
In the same way, you can consolidate other query parameters and capture them in a new, virtual page name. Just make sure to apply this filter before removing all query parameters.
In addition, which we talk about in a second, you can use this information to set up useful content groups in Google Analytics.
Set up Content Groups
Unfortunately you’re not done yet after you have successfully removed (most of) the query parameters.
This since you will still likely encounter a ton of different product pages, category pages and other pages you would want to look at an aggregate level as well.
Setting up content groups is the way to go here!
Once again, make sure to read this post to learn all you ever want to know about content grouping.
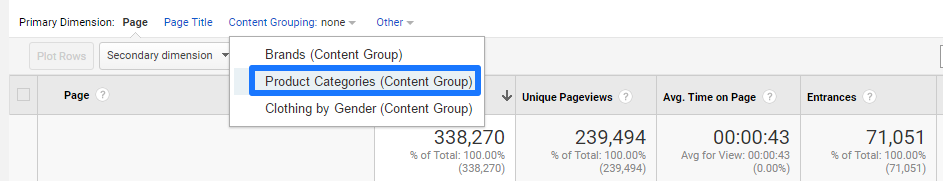
On the view level you can set up five different content groupings. It means you could group your content in five different ways.
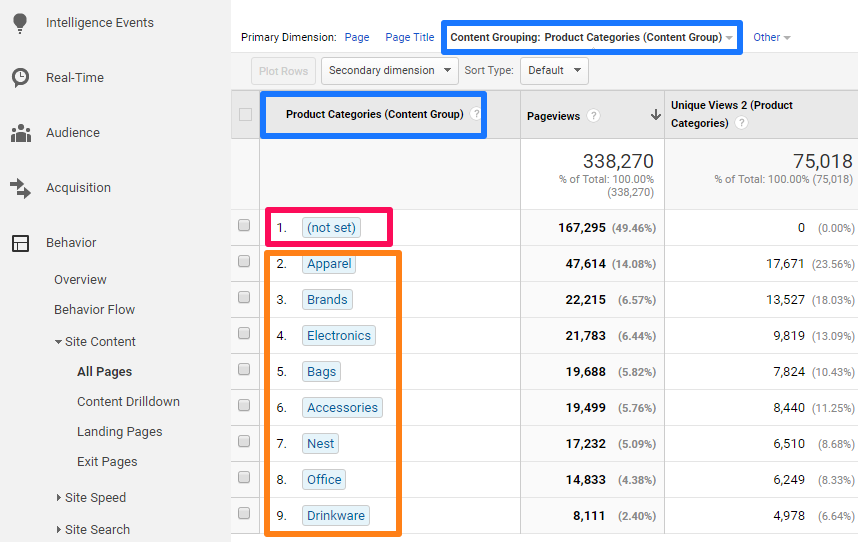
Here is an example of how Google has defined their content grouping (Google Analytics Demo Account):
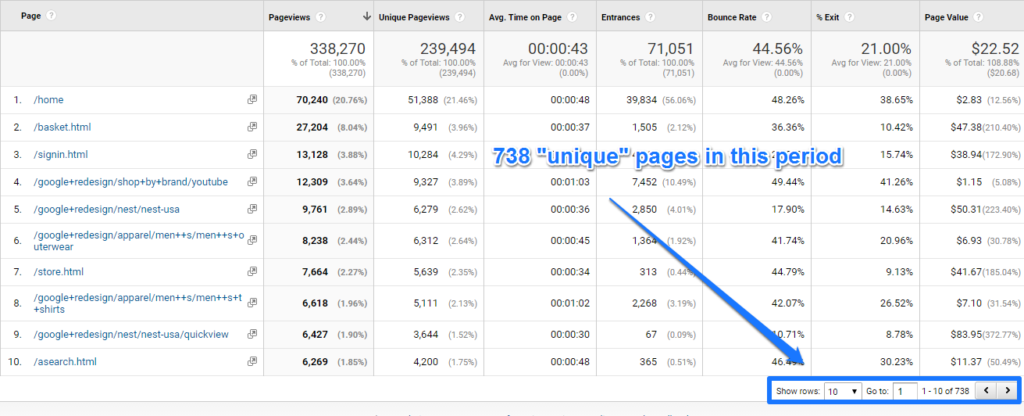
And this is how their original list of pages looks like:
A few things to note here:
- By setting up this content grouping, Google reduced 738 different pages to eight product categories and one (not set) group.
- The (not set) group consists of pages that don’t fall into one of the other eight “buckets”.
- I personally prefer not to work in this way, as (not set) makes up 50% of all page queries.
- That’s why I most often build “hybrid” content groups that allocate at least 95 to 99% of all pages to a bucket.
- At the very least, you can now easily see how much traffic falls into each product category.
- Drinkware is a very small segment and Apparel is the biggest.
You have also the opportunity to review where your website visitors entry your site:
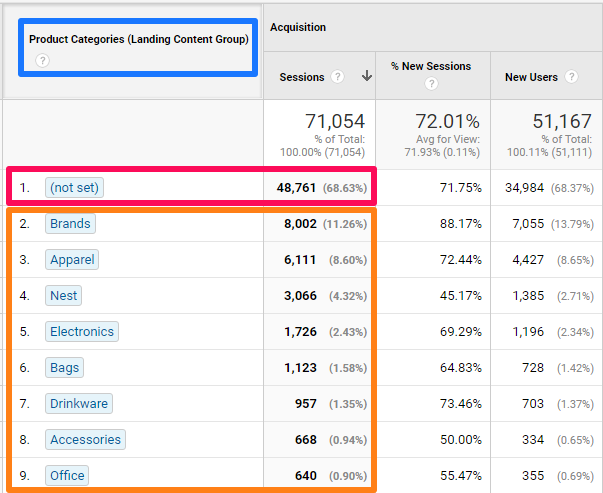 This numbers quickly reveal that:
- The majority of all website visitors (2/3 of them) land on a non-product category page.
- Landing page distribution is not completely in line with pageview consumption.
- “Brands” tend to attract a lot of new visitors (via campaigns?) and “Nest” shows a low “new sessions” percentage.
“You could opt for not removing the query parameters and just look into your content groupings. I prefer to use both (all pages report and content groupings); that’s why I use each of the strategies. In addition you will want to reduce the number of “unique” pages so that you can keep the bucket (other) as small as possible in your pages report.”
Let’s dive deeper into a couple of additional ways to leverage these content groupings as an Ecommerce business.
Leverage Page Value Metric
Prerequisites for this analysis are:
- Correct definition of a content grouping.
- Correct implementation of (Enhanced) Ecommerce; at a minimum transaction tracking.
Step 1: navigate to Behavior >> Site Content >> All Pages.
Step 2: change your view to “product categories” content grouping view.
Step 3: remove (not set) group with table filter and filter on page value worth.

The page value metric is defined as:
“The average value of this page or set of pages. Page Value is ((Transaction Revenue + Total Goal Value) divided by Unique Pageviews for the page or set of pages)).”
Here are some thoughts on how to use this metric:
- First of all don’t define goal values if you want to strictly evaluate your pages on Ecommerce performance.
- Judge the numbers in terms of correlation to Ecommerce performance instead of a direct causal relationship. The way people navigate through your website can greatly affect the numbers that you see.
- The page value of checkout pages (if you set up a separate bucket) will always be higher than for your PDP or category pages.
- Will address this later, but make sure to use segmentation (on channel, content group etc.) to learn more about the performance of your website visitors.
In short, this page value metric can be extremely powerful in learning more about your content. Whether those are PDP, category pages, or simply a store locator or blog, you will find out how well that content correlates with conversion.
I hope you already feel how powerful content analytics actually can be!
User Journey Analysis
In one of my previous article I spoke about how to make the navigation path analysis incredible useful. Review this article to learn about all details.
Here I will address one simple report:
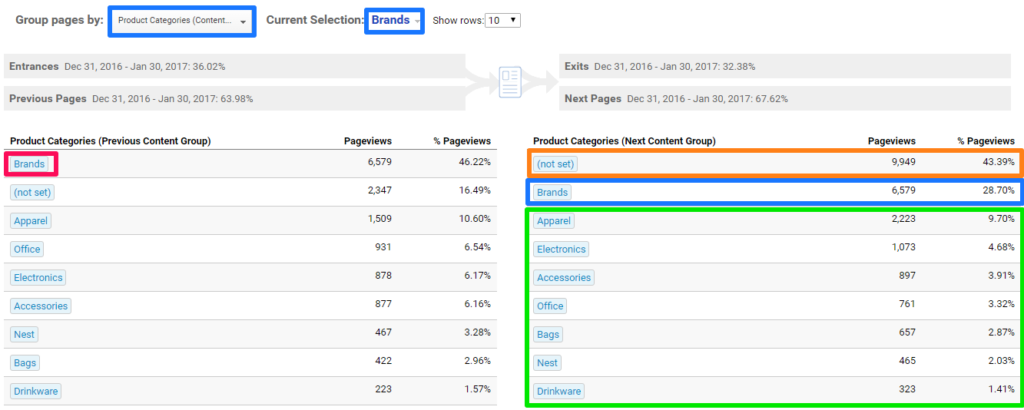 What do we learn from this?
We can roughly say that:
- 46% of the website visitors that are on a “Brands” product category page originate from a “Brands” category page.
- The website visitors that see another page go to:
- 43%: a page other than a product category page.
- 29%: a “Brands” product category page.
- 28%: a product category page other than “Brands”.
For even deeper analysis, I recommend to take a look at the “Behavior Flow” report:
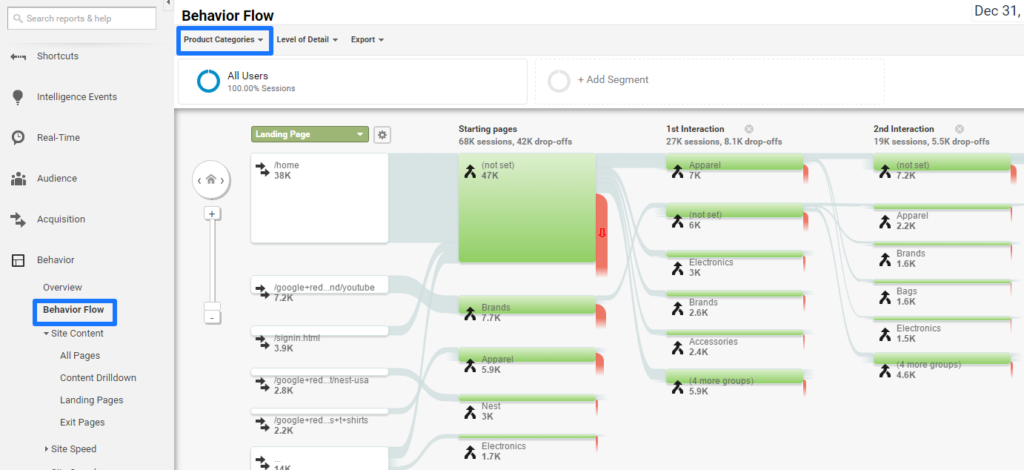
Opposed to simply look at an individual page, you can now better judge the performance and navigational paths on a higher level.
You are about to understand a lot more about the user journey on your site!
Content Group Segmentation
As you might know, segmentation is the key to finding actionable insights for your business.
I recommend to review these articles first if you are new to segments in Google Analytics:
- In-Depth Overview of Different Google Analytics Segments
- 10 Conversion Segmentation Tips to Optimize Your Online Business
- 20 Ecommerce Segments to Improve Your Customer Insights
- How to Leverage Sequence-Based Segments in Google Analytics
- 10 Differences Between View Filters and Segments
Back to the Google Merchandise Store. Here is an example of how to make segmentation useful.
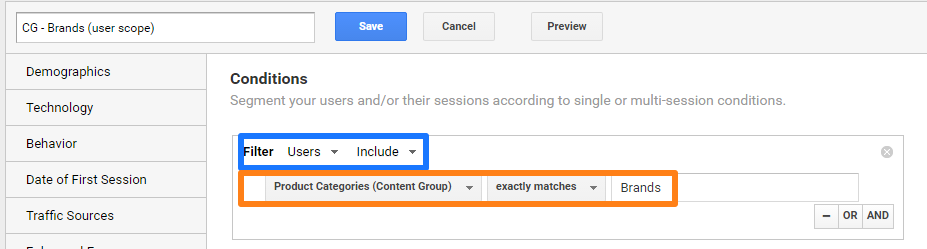
“You are promoted to a role of Brand Manager of the Google Merchandise Store. Your task is to find out which other content people view when visiting a “Brands” category page. Your director like to know this both within a session as well as over a longer period of time.”
Here are the two segments:
CG – Brands (session scope) – includes 28,5% of total pageviews
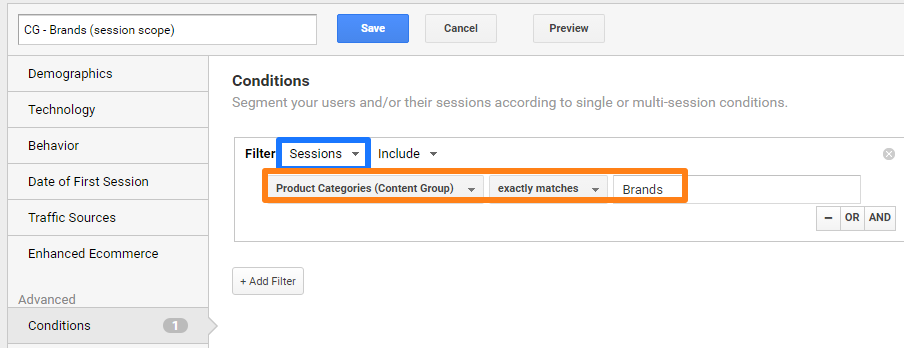
CG – Brands (user scope) – includes 34,9% of total pageviews
And here is the resulting report (filtered on top 5 product categories):
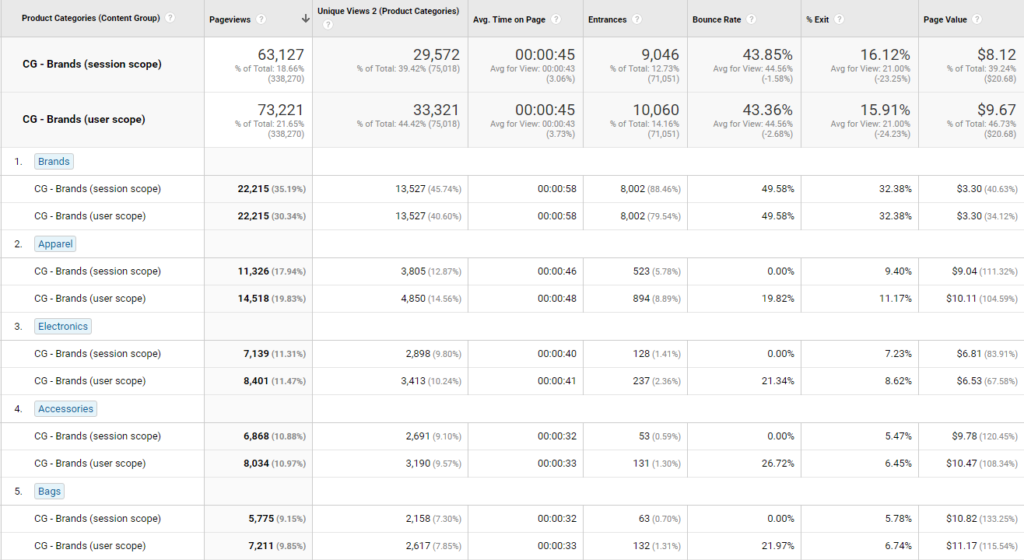
You can now get an idea (both on the session and user level) how often other product categories (outside of Brand) users visit during a session or during a selected period on same device/browser (as a user).
This information will be your guide in answering your director’s questions.
You can come up with a ton of other ways to help content group segmentation guide your Ecommerce optimization efforts.
Framework for CRO
There are two more things I like to address in this post.
You can use content grouping and page values in two more incredibly useful ways:
- Define conversion segments based on customer intent.
- Calculate CRO effectiveness for each of your content groups or website templates.
1. Define Conversion Segments
Not everybody that visits your website is going to convert. I like to divide website visitors in three groups:
- People that never will convert on your website.
- People that might convert on your website.
- People that will always convert on your website.
In my opinion you should primarily focus on group 2 in terms of Ecommerce optimization. Group 3 is also important in a sense that you don’t want any technical/usability hurdles to prevent them from converting.
But what do I mean with a conversion segment in this context?
I would like to refer to defining a segment that can be useful for your CRO optimization efforts.
A simple example. Your website consists of the following templates:
- Homepage
- Category pages
- Subcategory pages
- Product detail pages
- Search pages
- Cart page
- Checkout pages
- Blog pages
- Corporate pages
You could define a content grouping that covers all your different content groups or website templates.
And like I showed in a prior example, you can set up session or user based segment on a particular group. You can include but also exclude specific website visitors in a segment.
Here is how to define a useful conversion segment for CRO purposes:
Step 1: Set up a content grouping that covers all your website templates (and make sure your have Ecommerce implemented on your site).
Step 2: Collect at least one to two weeks of data.
Step 3: Analyze the page value metric of each of your content groups.
Step 4: Find out which content groups (maybe the blog and corporate pages) very much underperform – don’t correlate well with conversion – compared to other pages.
Step 5: Set up an exclusion segment to remove all sessions focused on content that doesn’t correlate at all with website conversion.
Step 6: Use this new segment – of people that might convert – as part of your CRO efforts.
2. CRO Effectivess of Individual Groups
My last point is closely related to what I outlined below.
To illustrate it a bit better, we need to take a look at the Google Merchandise Store numbers again:
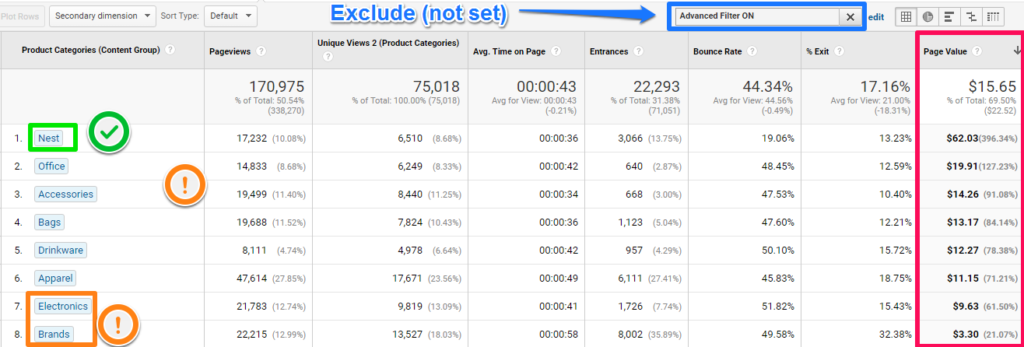
Let’s assume your website reflects the product categories shown above. Where would you start to optimize?
You could think in many directions – five different opinions:
“Nest product category pages correlate very well with conversion. Many people convert after visiting one of these pages so we should try to squeeze even more money out of them.”
“Apparel pages have the highest number of unique views so many people visit these pages. We should try to lift the CR here to increase the page value and our bottom line.”
“Oh, our Brands pages perform so poor currently. It should be easy to at least squeeze a few extra dollars out of them. Just some minor tweaks will do.”
“No guys, you are all wrong. We should look at the category with the highest margin first.”
“No way! We can simply optimize all categories at a the same time as people will behave the same in each category.”
Which opinion should you follow? That’s completely up to you as you should take a ton of other factors into consideration while defining your CRO strategy.
Well, this is it from my side. I hope this post had shed some light on Ecommerce Content Analytics and Optimization.
I am happy to hear your thoughts, so make sure to share your experience and tips in the comments below.
One last thing... Make sure to get my extensive checklist for your Google Analytics setup. It contains 50+ crucial things to take into account when setting up Google Analytics.Download My Google Analytics Setup Cheat Sheet
The post Expert Google Analytics Guide to Ecommerce Content Analytics appeared first on Online Metrics.