Segmentation and insights are like marathon training and delivering a top performance. You can’t expect great results without a solid strategy and preparation. In this post I discuss in-product segmentation strategies to improve your Analytics insights and ROI.
Back in 2009 I ran my third marathon and I set my teeth in breaking the 3-hour barrier. Anyone who runs, knows that most people can’t do that with proper training.

At that time I became fascinated by the field of Digital Analytics. Shortly after I realized segmentation is the key for improving any business, both online as well as offline.
In the rest of this post you will learn about 20 effective segmentation strategies to improve your Google Analytics Insights and ROI.
Table of Contents
- Basic Features
- Google Analytics Dimensions
- Google Analytics Segments
- Custom Reports
- Tailored Reporting Views
- Google Analytics Add-Ons
Basic Features
There are a few basic features in Google Analytics that can be extremely helpful in relation to segmentation and deriving Google Analytics insights from your data. Let’s look into each of them!
1. Date Range Comparison
Segmenting on date range or time period can bring a lot of insights. How does my website or a particular channel perform compared to last month?
The Google Analytics shortcuts feature is very handy here: press SHIFT + ‘?’ keys on your keyboard.
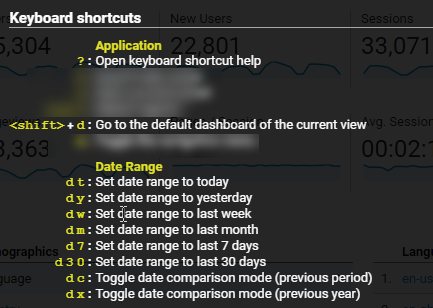
Here is a quick example for the Google Merchandise Store:
Step 1: navigate to Conversions > Ecommerce > Overview (in Master View).
Step 2: press ‘d 7’.
Step 3: press ‘d c’.
Step 4: review data.

Be mindful about how you compare your data as month-to-month (same year) comparisons might generate unreliable stats. For example, March counts 31 days and February counts only 28 days (or 29).
2. Table Filters
Another great way to filter and segment on your data is by using the table filters functionality in Google Analytics.
Two options:
- Basic table filters: segment on the primary dimension.
- Advanced table filters: segment on one or more primary and secondary dimensions including metric conditions.
Here is an overview of the top landing pages of the Google Merchandise Store (Ecommerce view):

In the ‘Basic Search’ field I can type in a simple Landing Page query. This is the first, basic step in segmenting your data.
However, you need to work with the ‘Advanced Search’ option if you (also) want to include metrics (or secondary dimensions) as part of your filter.
Kate wants to get an overview of the landing pages with and Ecom CR% < 1% and > 100 Sessions.
 And this is how the corresponding report looks like:
 There is one clear underperformer here!
The more advanced your table filters are going to be, the more important it is that you learn about Regular Expressions in Google Analytics.
3. Plot Rows
Plot rows can be a useful way to quickly and visually analyze a few dimension values. Sometimes I use this feature when doing client workshops.
A quick example:
Step 1: select report rows that you want to plot (visually see).
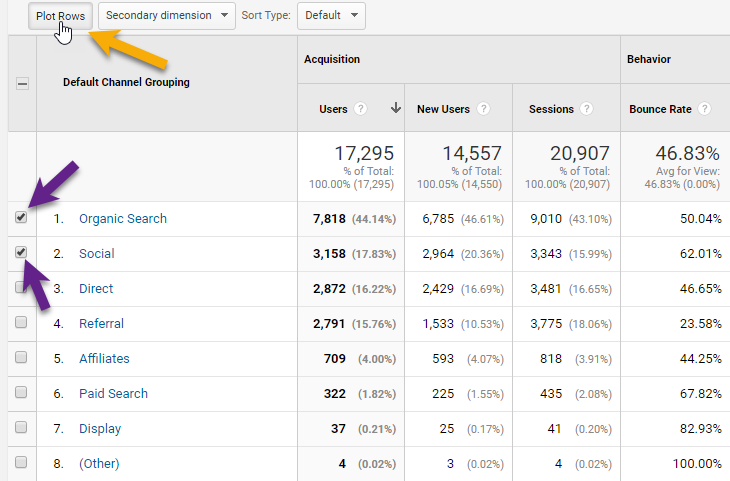
Step 2: select the metric(s) that you want to analyze.
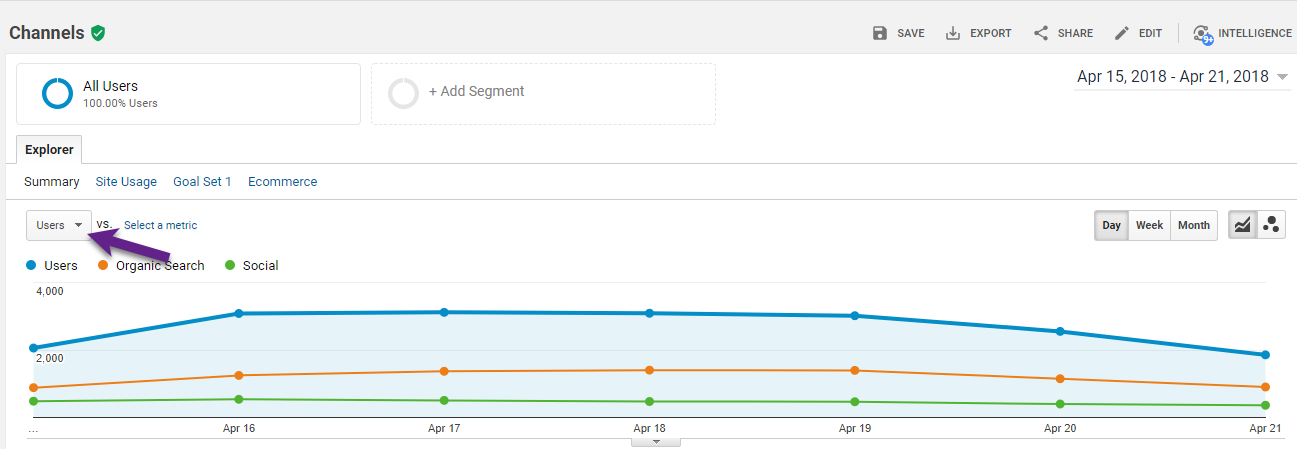 Two things that I immediately notice here:
- The total users count tends to follow the performance of Organic Search (the largest channel here).
- On April 17 – 19 Organic Search brings in relatively a lot of visitors compared to Social.
Important to know is that you can select six dimension values at most and that the overall metric(s) can’t be removed.
That’s why I usually only include the larger dimension values.
Further, I recommend to only plot three rows at max.
This is how it looks like with six plotted rows (clumsy, right?):

Google Analytics Dimensions
There are many different ways to leverage dimensions for Google Analytics insights. In this section I describe four powerful ways to make use of dimensions.
4. Primary Dimensions
Metrics and dimensions are key in building reports and analyzing data in Google Analytics.
The primary dimension allows for a first and basic segmented analysis of your data.
 It turns out that referral traffic is responsible for 15% of users, 20% of sessions and 64% (!) of revenue.
In this case I definitely want to learn more about the referrals that drive traffic to this website.
5. Secondary Dimensions
Now, I can use a secondary dimension to further drill down on the available data.
Step 1: select ‘full referrer’ as the secondary dimension.
Step 2: search on ‘referral’ in the basic search filter field.
 Literally in less than a minute you discover a few important Google Analytics insights:
- There are only a few ‘sites’ that are driving the referral conversions.
- Those are not caused by incoming links from authority sites, but correlate to ‘internal’ links.
- Referral conversions are almost solely related to internal / Google employee purchases.
- Last but not least, there might be a few implementation and configuration tweaks needed here. ;-)
6. Tertiary Dimensions
In the last example there were two active dimensions. Even without creating a custom report you can drill down to three (or four) dimensions.
Let’s look at three dimensions first.
Step 1: navigate to ‘Default Channel Grouping’ report.
Step 2: select ‘Organic Search’.
Step 3: change ‘keyword’ as primary dimension to ‘source’.
Step 4: click on source ‘google’.
Step 5: select ‘landing page’ as secondary dimension.
In this case the ‘primary dimension’ becomes the ‘secondary dimension’ and the ‘secondary dimension’ the ‘tertiary dimension’.

7. Quarternary Dimensions
Let’s take it one step further.
Step 1: navigate to ‘Default Channel Grouping’ report.
Step 2: select ‘Organic Search’.
Step 3: change ‘keyword’ as primary dimension to ‘source’.
Step 4: click on source ‘google’.
Step 5: change ‘source’ as primary dimension to ‘landing page’. // new step
Step 6: select ‘country’ as secondary dimension.
Here we go:
 This allows for a deeply segmented analysis on Organic Search performance.
Yes, we can do this with custom reports and outside of Google Analytics (e.g. with Google Analytics API). But as you can see the reporting interface itself is very flexible in uncovering actionable insights for your business!
8. Custom Dimensions
The last thing I like to share is using Custom Dimensions.
“Custom dimensions allow you to add useful, additional information to hit, session, user and product data that you send to Google Analytics.”
This Google Analytics feature allows for endless data segmentation and optimization opportunities.  The Google Analytics configuration is the easy part of getting Custom Dimensions to work for you.
Having a good understanding of the technical implementation and Google Tag Manager is very useful here. You might want to work with a developer to get your Custom Dimensions implemented.
Here is an example of how you can select a Custom Dimension as a secondary dimension in Google Analytics. Read this extensive Custom Dimensions guide to learn more about how to set them up for gathering Google Analytics insights!
Google Analytics Segments
The built-in Google Analytics segments feature is one of the most powerful features to segment your data.
There are four segment types that you should know about.
9. System Segments
With system segments you can make a great start in getting to know the segments feature.
Here is an overview of the currently available system segments:

You can apply one of these segments to almost all reports in Google Analytics.
One of the exceptions is the goal funnel report in GA as you can’t apply segments to this report.
However, you can set up a Custom Funnel report and apply segments if you are on GA 360.
 Another option would be to leverage Enhanced Ecommerce for segmented funnel reporting.
10. Sequential Segments
The second type of segments are sequential segments.
You can use them for a variety of reasons:
- Analyze checkout abandonment.
- Test funnel steps.
- Enhance Remarketing efforts.
- Identify pogo-sticking behavior.
- Setting up exclude segments.
Here is an example (Google Merchandise Store).
Step 1: identify main goal and first two funnel steps.
 Step 2: add them to a sequential segment.
Step 3: apply new segment to report (e.g. Geo > Location).

A ton of Google Analytics insights are to be discovered if you apply sequential segments worth analyzing for your business KPIs!
11. Cohort Segments
First, you can perform a cohort analysis via the Cohort Analysis reports in Google Analytics.

The second thing that you can do is building a segment direct from the cohort analysis report. Here you can review it:
As you can see, it uses both the ‘Date of First Session’ and an advanced condition.
For those of you who are more experienced with cohort analysis – you can build you own cohort segments as well (!)
12. Flexible Advanced Segments
And then, based on your unique business and informational needs, you can build your advanced segments based on many different criteria.

Ok, you might be overwhelmed with all of the options.
Make sure to start with the ‘system segments’ if you are just starting out. Keep in mind that this is one of the most powerful features of Google Analytics.
Segments allow you to gather tremendous insights on user behavior and optimization opportunities. You want to make sure getting acquainted with them!
Custom Reports
Creating custom reports is another way to segment your data for getting Google Analytics insights.
Most of you can build three different reports, but you have one extra option if you are on GA 360.
Let’s look into all different options that you have here.
13. Explorer
The Explorer report is the basic report. It includes the line graph and data table you are used to see in Google Analytics reports.
A quick example is shown below:


In addtion, you could add table filters and/or secondary dimensions for a more segmented view of your data.
14. Flat Table
The Flat Table is the second type of custom reports and can be very useful to create a segmented overview on multiple dimensions.
You can add five dimensions at a time, but then your report can get quite clumsy as you can see below:

 Personally, I prefer to get my GA data into Google Sheets (via the Google Analytics API) if I want to analyze it based on several dimension values.
Google Data Studio is a great option if you want to visualize your segmented data for yourself or key stakeholders.
15. Map Overlay
The Map Overlay report can be great for creating a quick visual and geographical overview of important web analytics metrics.


You can see at a glance that the Google Merchandise Store sessions and Ecommerce performance is dominated by the United Sates.
16. Custom Funnel
Unfortunately Custom Funnels are only available in GA 360. They are incredibly powerful as you can build and segment funnels on the fly.
And you can apply them retroactively on your data.
You can also build event-based funnels which isn’t possible with the goals feature in Google Analytics.
Here is quick example (only the first stage is shown):

And this is how the Custom Funnel report looks like (mobile traffic segment is applied):
 It’s incredibly powerful and the report can deliver tremendous insights in Google Analytics.
- Which segments are underperforming in one of your main website flows?
- What are important website flows on your website?
- Is there an opportunity for well-targeted Remarketing campaigns?
And there are many more opportunities to think of when analyzing Custom Funnels in Google Analytics.
Tailored Reporting Views
Reporting views provide you with additional powerful ways to segment your Google Analytics data.
17. Separate Views
In each Google Analytics setup I recommend setting up at least three different reporting views:
- 01 Master View
- 02 Test View
- 03 Raw Data View
You might want to set up extra views based on your business, objectives and market(s) where you are in.
Think about device, traffic and location specific views. Or maybe you only want to gather the data of a testing environment in one of your views.
Here are two useful articles you should check out:
- 22 Best Practices for Optimizing Your Google Analytics Views Setup.
- Ultimate Guide to Using Google Analytics Filters.
18. User-ID
Everybody who has a good understanding of their business, admin filters and views can set up additional views.
The tricky part is setting up a User-ID view in Google Analytics.
“When a person loads a page on your website, GA assigns a Client ID, which is unique to the specific browser and device and stored in cookies. You can use the User-ID if you have some way of identifying an individual person.“
Here you can review the necessary steps to implement the User-ID feature on your site.
Keep in mind Privacy Rules when implementing this feature.
Enabling and implementing the User-ID allows you to set up a specific view where User-ID hits are stored.
This view comes with a lot of new, segmented reports:

The User-ID can be challenging to implement in some cases, but the extra Google Analytics insights are more than worth it.
Last tip: send the User-ID values with a hit-level Custom Dimension to Google Analytics. You can use this date (to segment on) in non-User-ID views as well then (!)
Google Analytics Add-Ons
Last but not least, there are several Google Analytics Add-Ons that can be really helpful for all of us. Two examples are discussed below.
19. Da Vinci Tools
A great add-on provided by Stéphane Hamel!
It can be very beneficial when using Google Analytics, Google Tag Manager and/or Google Data Studio.
Specifically for Google Analytics it has several features that can help with segmentation, but it includes many more features which are regularly updated.
Overview of features:

Da Vinci Tools in Google Analytics:

Here you can get the Da Vinci Tools (Chrome Add-on). Give it a try and let me know what you think!
20. Vizanda
The last segmentation strategy I like to mention is related to Vizanda. It is relatively new and includes one great feature!
Just check out this short video to learn more:
This is it from my side! What are your thoughts on effective segmentation strategies to derive Google Analytics insights for your business? Happy to hear your comments!
The post 20 Segmentation Strategies to Improve Your Google Analytics Insights and ROI appeared first on Online Metrics.