Custom metrics belong to the most underused features in Google Analytics. Read this article and empower yourself to enhance your setup and insights with custom metrics!
In previous articles I’ve shared a lot about pre-defined metrics and calculated metrics.
Without doubt, both groups of metrics are tremendously powerful. However, a lot of extra optimization opportunities arise once you have defined insightful custom metrics for your business.
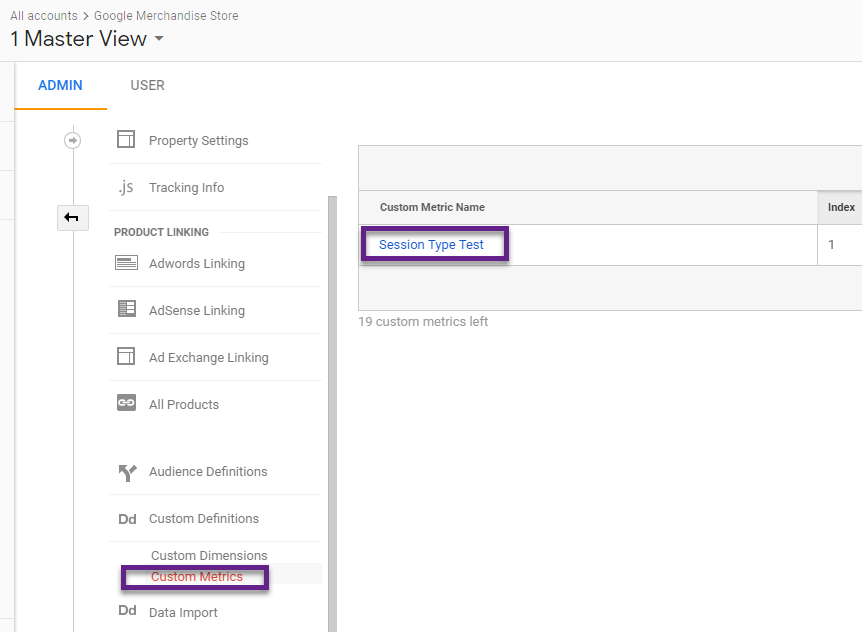
In the Google Demo Store there is just one custom metric configured. We will take it to a whole new level!.
In this post I explain in all depth about custom metrics based on an actual use case.
And the greatest thing is that you are able to replicate this method in your Google Analytics account!
Table of Contents
- Introduction to Custom Metrics
- Measurement Plan
- Event Tracking Implementation
- Custom Metrics as a Solution
- From Custom Metrics to Calculated Metric
- Building Custom Reports
- Analysis and Optimization
- Concluding Thoughts
Introduction to Custom Metrics
Both custom dimensions as well as custom metrics can greatly enhance your Google Analytics data.
Similar to custom dimensions, custom metrics can have different scopes.
- Hit-level custom metrics: are associated with all the hit level dimensions with which it was sent.
- Product-level custom metrics: are only associated with the product with which it was sent. You need to have enhanced ecommerce implemented if you want to leverage this feature.
In the rest of this post I will share the process behind and an actionable example that applies to a hit-level custom metric.
Measurement Plan
Let’s go one step back here.
Before thinking about leveraging any Google Analytics feature, you should get clear on your measurement plan and goals.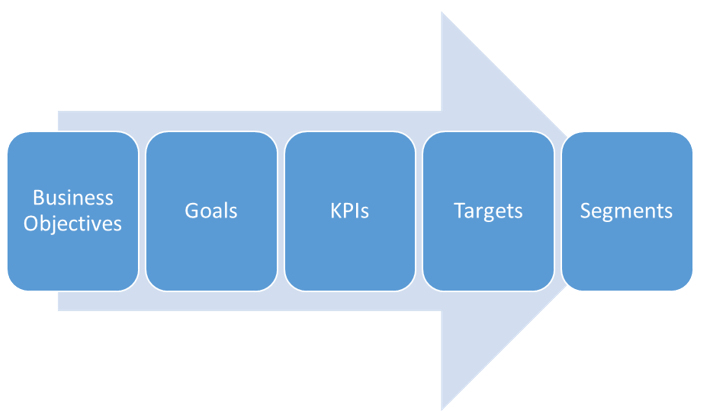
You can look at any organisation from a strategical as well as tactical perspective. This is also how the measurement framework works.
(Strategical) Business Objectives > Goals > KPIs > Targets > Segments (Tactical)
Teachable and Email Acquisition
Let’s look at a real-life example of Teachable.

Teachable offers a platform to create and sell online courses.
As their primary lead magnet they offer a “Course Creation Book” which is very relevant to their target audience.
- This sign up modal shows up if someone shows behavior similar to when you want to leave a website.
- It only shows up one time – unless you delete your cookies, come back on another browser/device etc.
Without going in all depth into their measurement plan, you can imagine that measuring the effectiveness of this modal is very relevant for their business objectives.
In fact, well-targeted “Email messaging” is crucial for growing most businesses online.
![]()
As you can see. Teachable has both Google Analytics and Google Tag Manager installed.
Quick Overview of Challenge
- Goal: optimize the modal effectiveness across many different dimensions.
- KPI: the main KPI is Modal Conversion Rate.
- Strategy: Re-creating the Modal Conversion Rate metric in Google Analytics.
Note: the stats in the blogpost use case don’t belong to the Teachable website.
Event Tracking Implementation
A logical first step in dealing with this challenge is setting up event tracking for the welcome modal.
Fire two events:
- Non-interaction event when the modal appears.
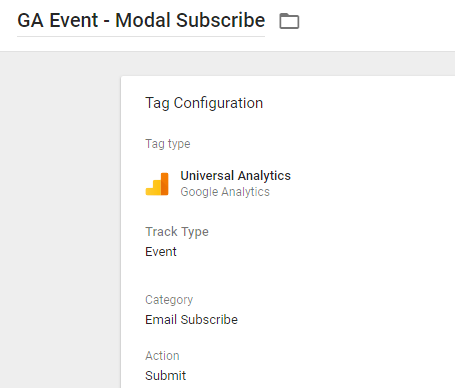
- Interaction event when someone successfully submits the form.
A simplified version of both events is shown below:
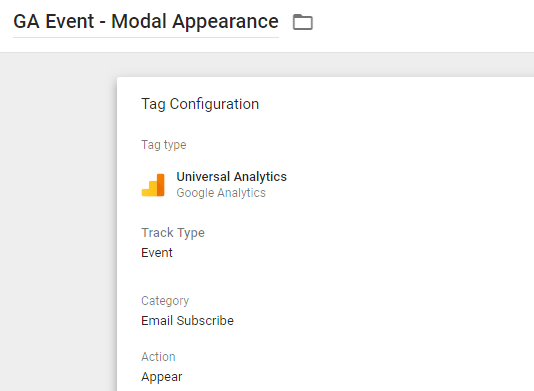
- Set a non-interaction event for “modal appear” – you don’t want to screw up your bounce rate stats.
- Use the event label for “modal version” or any other characteristic that is important for you.
- As always, make sure to use proper naming conventions for your GTM setup.
Note: it depends on your skills and responsibilities, but you might need the help of a developer to get this implemented on your site.
Event Tracking Data
This is how the event tracking data would look like:
![]()
Here I filter on the right event by:
- Setting “Event Category” as the primary and “Event Action” as the secondary dimension.
- Applying a table filter on both dimensions and required values.
As expected, the Total Events number only slightly deviates from the number of Unique Events.
So far so good, the data is coming in correctly.
Note: check the same stats for the “Email Subscribe” event to ensure this data is flowing in correctly as well.
Event Tracking Challenge
Event tracking is a great start, but in this case it is not the entire solution to our challenge.
Prior in this post I already mentioned about the Modal Conversion Rate metric. There is no way in getting this metric into Google Analytics solely based on event tracking.
Further, is it very difficult to pair event tracking stats with all sorts of dimensions in Google Analytics. And this is something that we want in order to optimize the Modal in many different ways.
Custom Metrics as a Solution
This is when custom metrics become your best friend.
- You can set up 20 custom metrics per property in the free version of Google Analytics.
- In GA 360 you can set up 200 custom metrics per property.
Custom metrics are implemented in a similar way as Custom Dimensions.
Here are four important steps to take:
- Planning
- Configuration
- Implementation
- Processing
1. Planning
In the initial phase you want to plan out which custom metrics need to be implemented to enhance your data and insights.
We will keep it simple here:
“Teachable wants to implement custom metrics to become more flexible in optimizing their Welcome Modal.”
In this case we want to implement two custom metrics:
- Custom Metric which increments by one each time the Modal shows up.
- Custom Metric which increments by one each time a user submit the Modal sign up form.
2. Configuration
Now we can move on to the next step and configure the custom metrics in Google Analytics.
Navigate to: Property > Custom Definitions > Custom Metrics.
Here you can see all info related to these custom metrics:
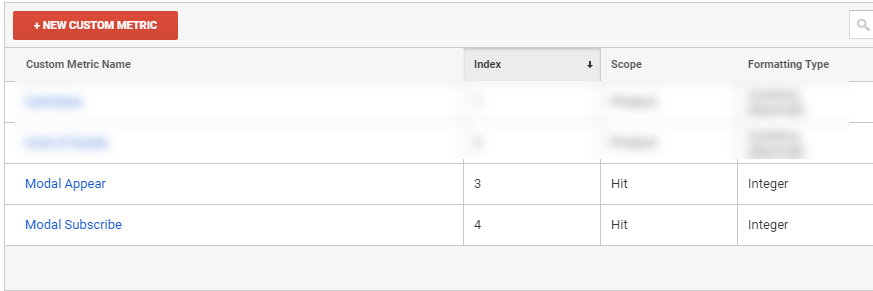
- Use naming conventions to ensure everyone can easily recognize and use the custom metrics.
- Custom metrics are hit-scoped.
- Formatting type is integer.
- Index slots used need to be connected to the actual implementation.
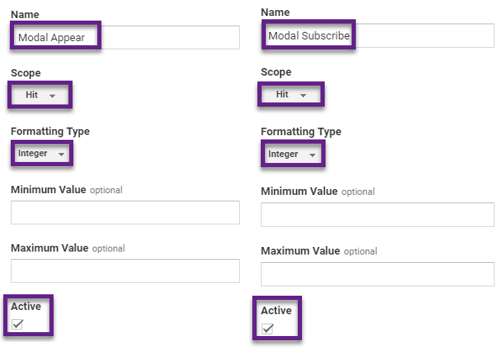
- Specify a minimum and/or maximum value if you need to. Later on I will set a fixed custom metrics value so there is no need for this.
Here is an example:
“You can also specify minimum and maximum values that determine whether Analytics will process this metric and include it in your reports. This can help prevent accidental large or small values from being collected and affecting your reporting. We can set a minimum value of 0 and a maximum value of 2, if we don’t want our range to exceed 1.”
3. Implementation
We are getting there as the required custom metrics are defined and configured in Google Analytics.
You can implement custom metrics hardcoded on your site, but a preferred solution is via Google Tag Manager.
The great thing is that you only have to slightly modify the pre-existing event tracking tags to get this to work.
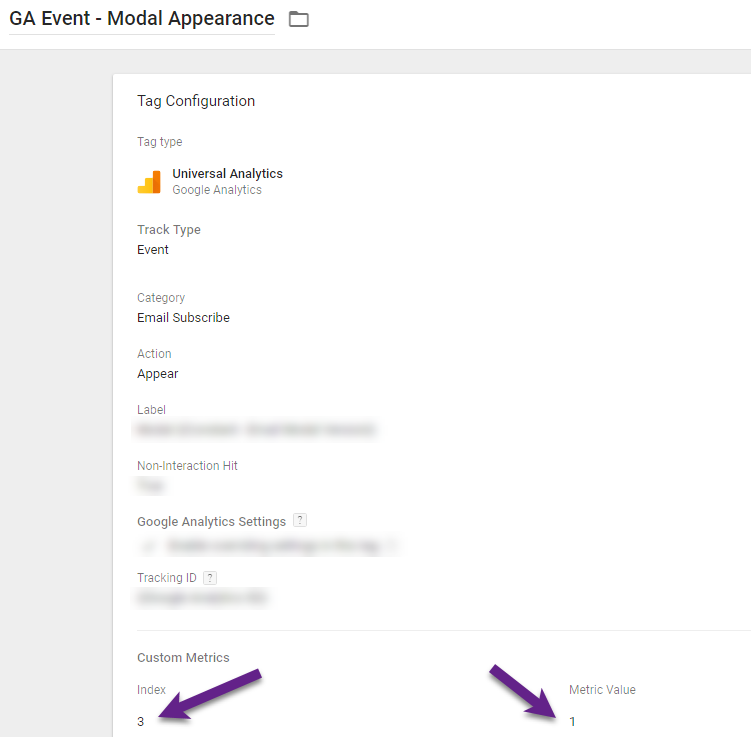
Here you can see how and where you need to modify the tags.
Custom Metric – Modal Appear
Custom Metric – Modal Subscribe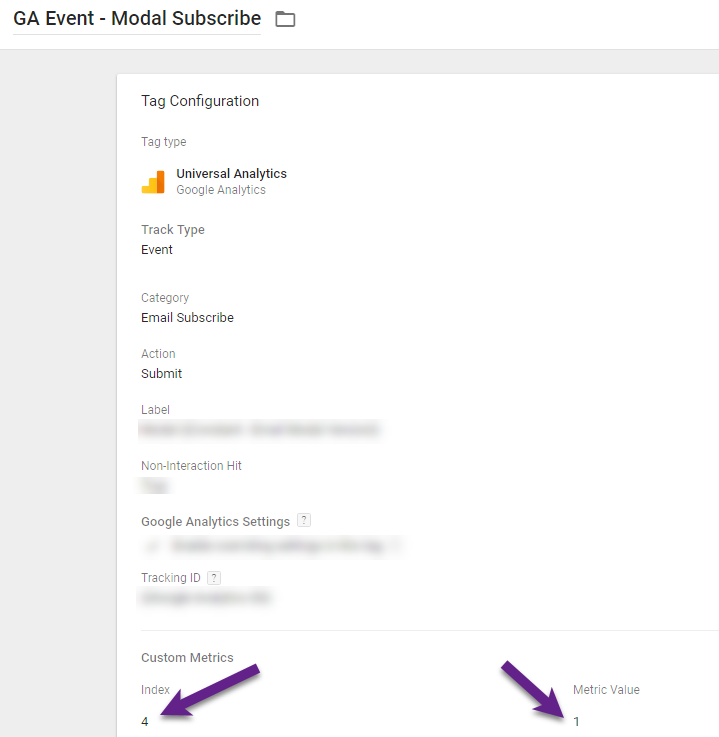
- Match the index number with the configuration in Google Analytics.
- Add a fixed value of “1” to let the metric increment with one with each hit / event send to Google Analytics.
4. Processing
It can take up to 24 hours before custom metrics are processed in Google Analytics.
There are several ways to check, but in this case I will build a quick custom report.
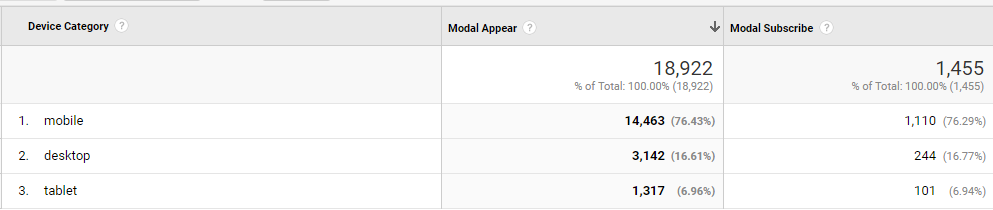
- You can add custom metrics to any custom report (incredibly powerful!).
- You can segment it on one or more pre-defined and/or custom dimensions.
- Numbers check on Modal Appear (difference < 1%):
- 18,922 = Modal Appear custom metric.
- 18,959 = Modal Appear total events.
From Custom Metrics to Calculated Metric
We have finally arrived at the last step in getting the actionable metric that we want!
The calculated metrics feature is very powerful as it allows you to create KPIs (not basic metrics) that are most in line with you business objectives.
“Calculated Metrics are user-defined metrics that are computed from existing metrics and drive more relevant analyses and enable greater actionability without leaving the product.”
Existing metrics refer to pre-defined (or default) metrics, but include custom metrics as well!
Here we go:
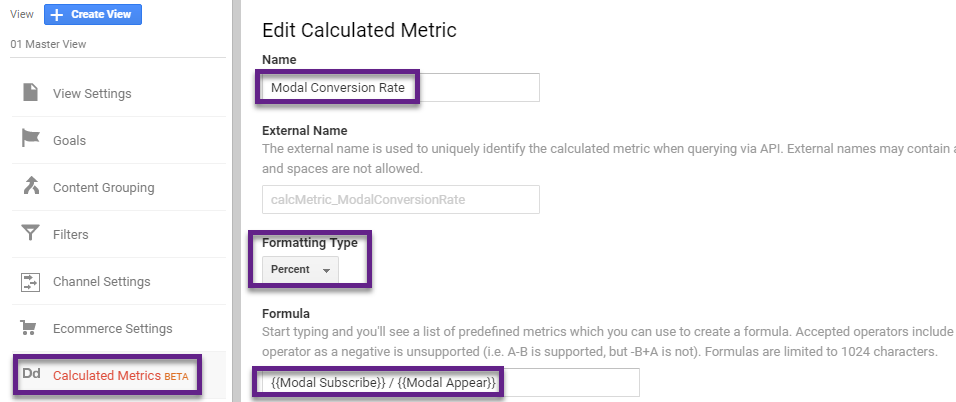
It’s very easy to set this up. You will get suggestions for the “Formula” as soon as you start typing in the “Formula” field.
Read my previous post on calculated metrics if you want to learn more about this feature. You can define five calculated metrics per view (50 if you are on GA 360).
Note: calculated metrics work retroactively on your data, but custom metrics don’t.
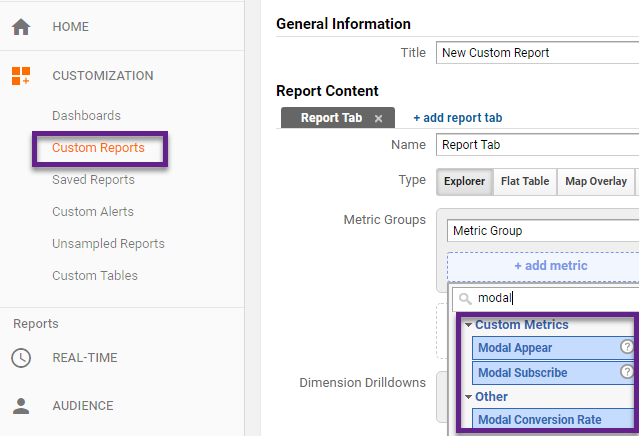
Building Custom Reports
Let’s elaborate a bit more on building custom reports.
You could use this new data to build a variety of reports in and outside of Google Analytics.
A few suggestions:
- Set up custom reports in of Google Analytics and share them with your team members.
- Use these new metrics in dashboards in Google Data Studio.
- Get your data in Google Sheets for advanced data analysis.
Here you can see that all metrics are available:
Analysis and Optimization
By now you should already have defined your most important and secondary business questions.
“What are you trying to solve or improve?”
A quick example of a use case.
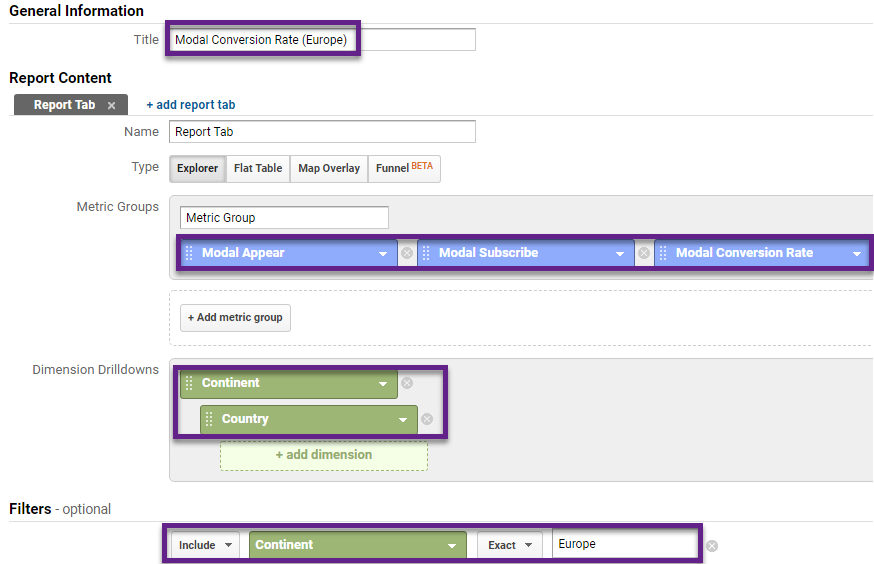
“You believe that in Europe the Modal Conversion Rate has dropped since the introduction of GDPR. You want to further examine the Modal Effectiveness on a country basis.”
I will create a custom report with a couple of metrics and dimensions to answer this fictional business question.
Metrics
- Modal Appear (custom metric)
- Modal Subscribe (custom metric)
- Modal Conversion Rate (calculated metric)
Dimensions
- Continent
- Country (available via drill-down)
Filter
- Continent = Europe
Custom Report Setup
Custom Report Data
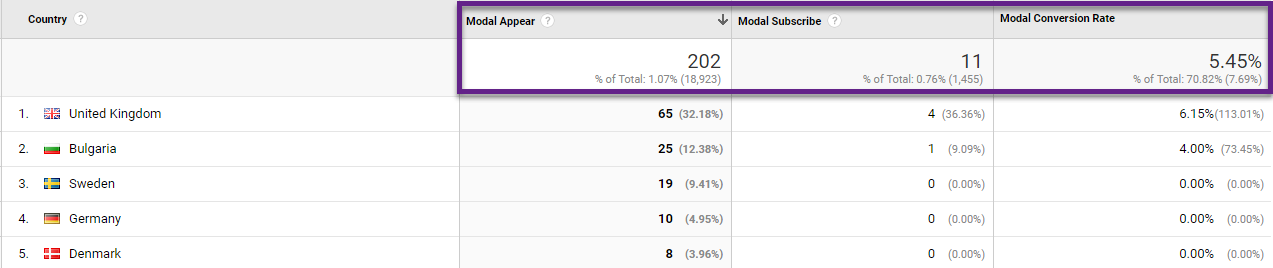
- Modal Conversion Rate metric works as 11 / 202 = 0.0545 (!)
- You need to have sufficient data prior to May 25 and after this date to make a good analysis.
- Create a Google Analytics segment to only include EU countries that are affected by GDPR.
Concluding Thoughts
Great to see you are still with me!
I hope you agree that custom metrics are incredibly poweful for any organization to leverage.
It’s all about getting your measurement plan right and defining the most important business objectives from the start.
Then you need to ensure your Google Analytics implementation is supporting you to get the insights that you need.
My last comments on custom metrics:
- A best practice is to set up custom metrics for the most important interactions and events on your website.
- Subsequently, you can cross-segment them with you most important dimensions for optimization purposes.
- Use them as well to set up A/B tests and analyze them in Google Analytics or to build out horizontal funnels.
This is it from my side!
If you haven’t yet, make sure to get started with custom metrics right away. And let me know if it helps you to improve your insights and KPIs, as it should!
The post The Complete Guide to Leverage Custom Metrics in Google Analytics appeared first on Online Metrics.