You won’t get far if you offer great products, but unconvincing product pages. In this post you learn several techniques for analyzing product page performance in Google Analytics.
No doubt that everyone reading this article has a lot of experience in dealing with product pages. You might be the owner of an Ecommerce shop or maybe you are responsible for Ecommerce Marketing and/or Analytics. At a minimum, you have seen several product pages during your own online shopping journeys.
In my experience, some of these pages are a big help in making a purchase decision. But at the same time, a lot of them need to be optimized in many ways.
Google Analytics can reveal a lot about individual product performance via Enhanced Ecommerce. In addition, you can make an aggregated analysis on the product page level. And that’s exactly where this new post is about!
Table of Contents
- Website Content and Goals
- Product Page Segments
- Session-Level Analysis
- User-Level Analysis
- Concluding Thoughts
First, we will dive into goal setting for different content areas on your site. This serves as a general introduction to the main topic.
And then you will learn in all depth about analyzing product page performance in Google Analytics. You can apply these techniques in other Analytics tools as well.
Website Content and Goals
“Only 1% of the visitors on my homepage buy my product, how can we get this percentage to 2% or higher?”
First of all, you need to be realistic in terms of current performance and what wins are possible to gain (in the short run).
Most importantly is to understand the function of each page. Some pages have a primary role in the purchase process, e.g. the checkout pages. But what about your privacy policy page?
In other words, the goal of a particular page on an Ecommerce site doesn’t have to be converting a visitor into a customer. At least, very often not within the same session as the page was visited.
Two examples are shown below.
Store Locator
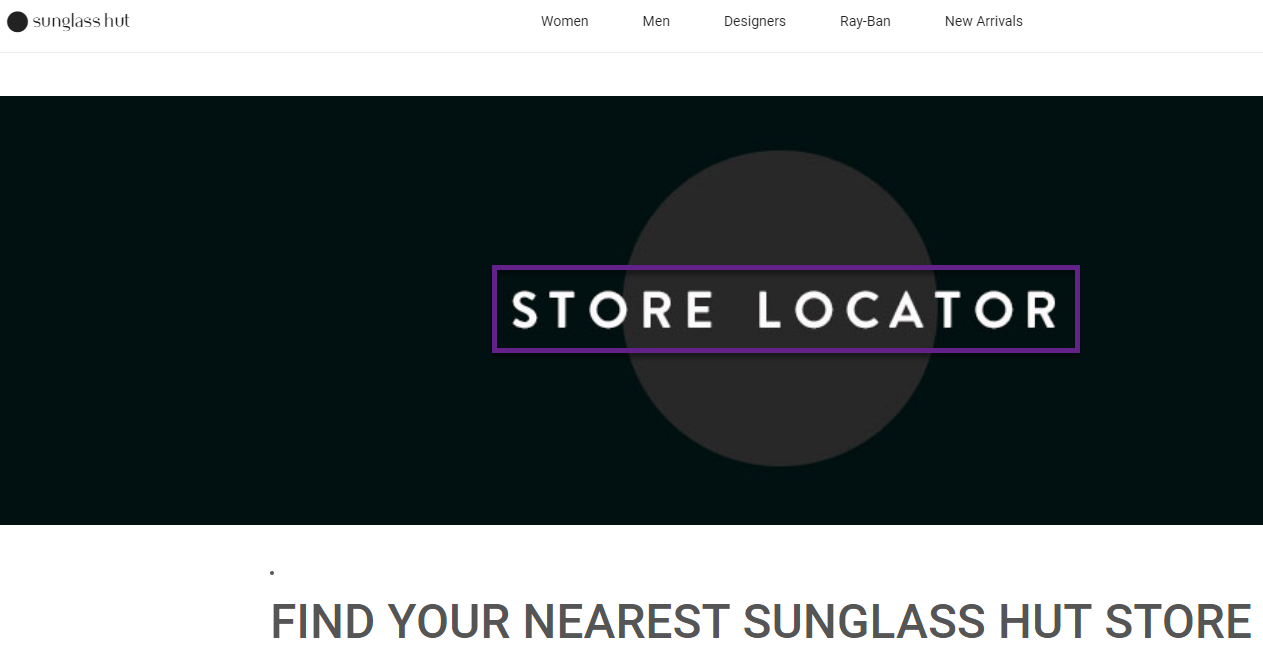
- It doesn’t make sense to analyze this page on transaction performance or other related metrics.
- Visitors to this page should be grouped under a non-converting “use case” (and not attributed to the online prospects segment).
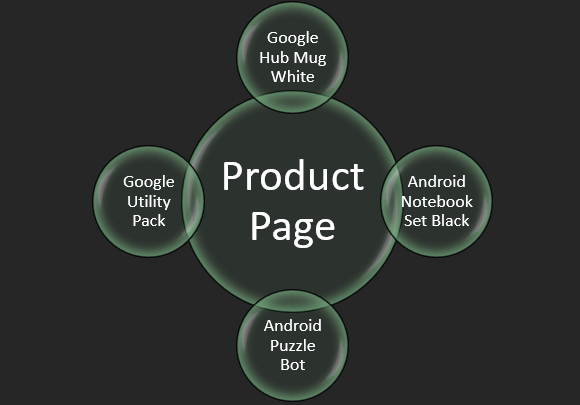
Overview or Routing Page
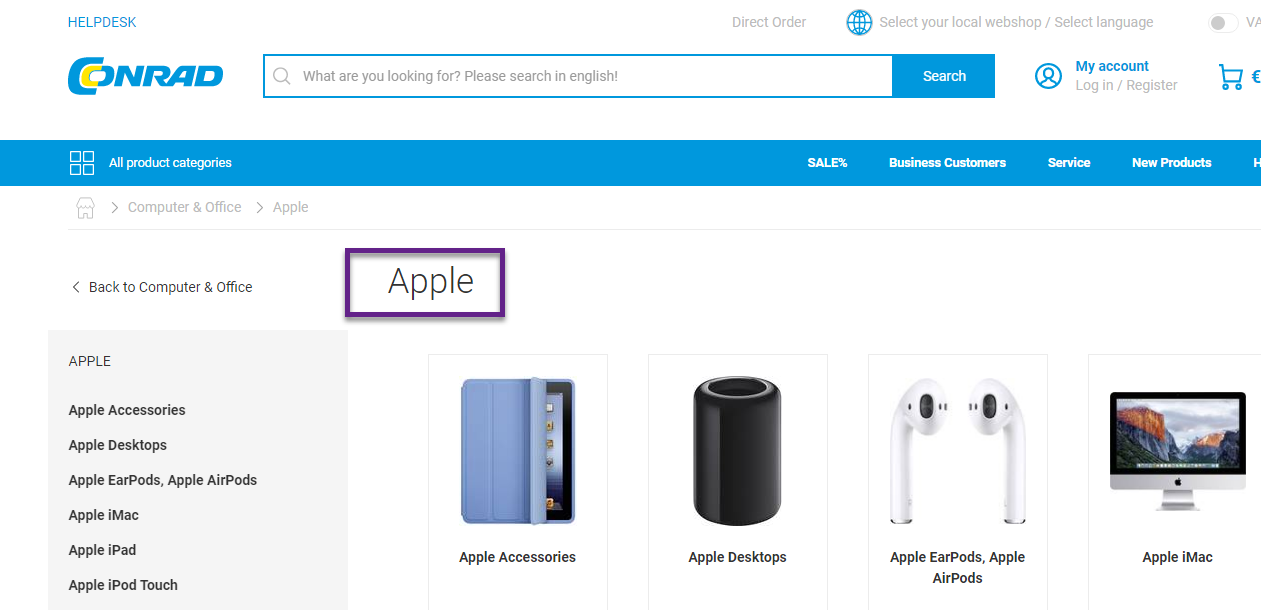
- This page serves as a subcategory overview page (Computer & Office > Apple).
- Main, expected routes are to a sub-subcategory page.
- Again, it wouldn’t make sense to directly/only judge the performance of this page in terms of transactions.
- I would recommend retrieving the percentage of visitors that navigates to a subcategory page of Apple. That could be the primary goal of this page, leading as many visitors as possible to a subcategory page of Apple.
And now let’s look into a product page.
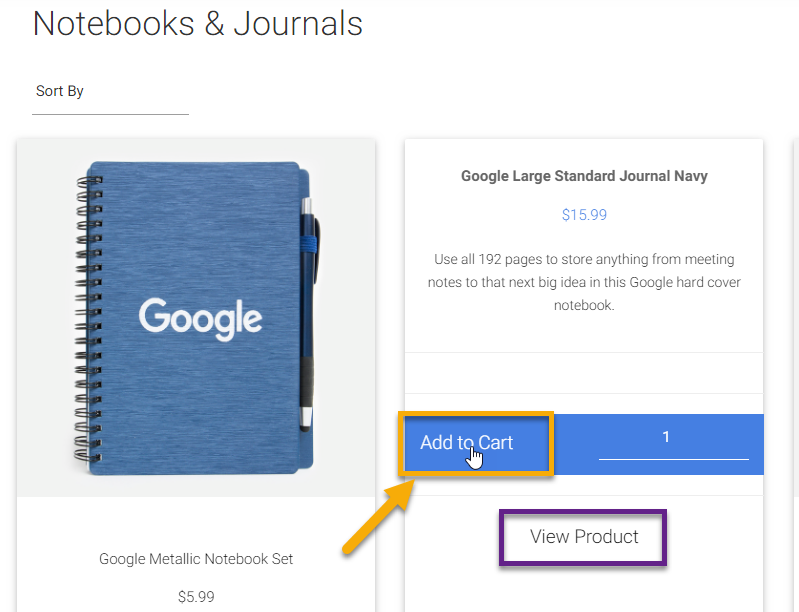
Product Detail Page (PDP)
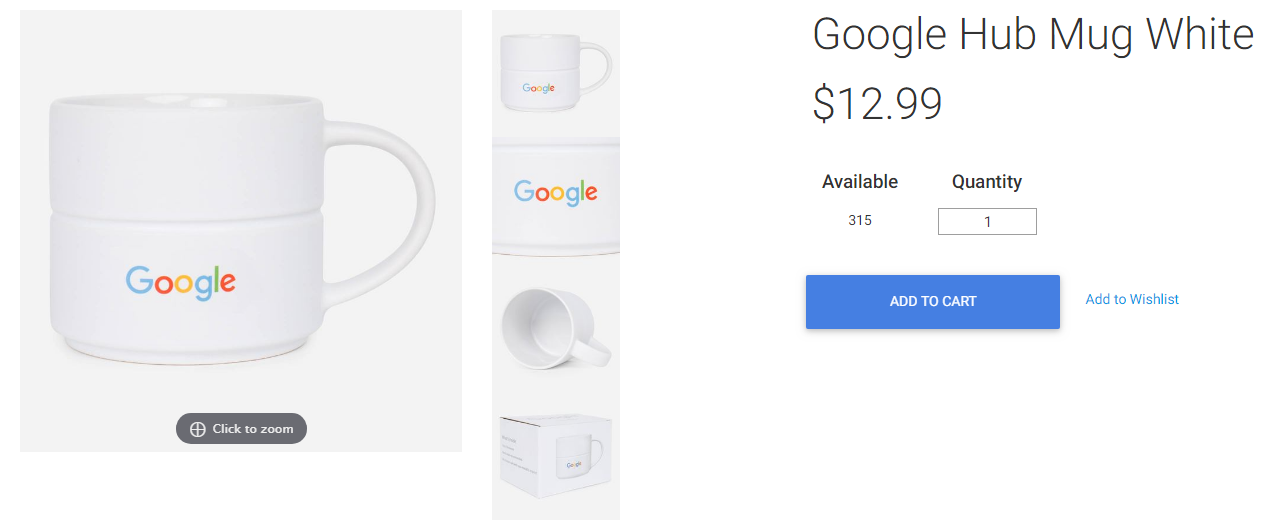
- No doubt that a lot of elements on this page are part of the purchase decision.
- Product image.
- Product price.
- CTA – Add to Cart.
- CTA – Add to Wishlist.
- Quantity selector.
- It makes sense to analyze the page performance in relation to a purchase.
- In addition, I would look into Add to Cart and Add to Wishlist conversions. Add to Cart conversions can be analyzed with Enhanced Ecommerce and the product performance report.
- Further, you can measure Add to Wishlist with event tracking.
In this blogpost we focus on analyzing product pages in relation to the main, purchase event and segmentation across different dimensions.
Product Page Segment
First step is to group all the pages on the website that belong to the “product page” segment.
As you might have guessed, we will focus the analysis on the Google Merchandise Store data.
I recommend reading this post on Google Analytics segments if you need a refresher on segmentation in GA.
In my experience, there are three scenarios when you want to set up a product page (PDP) segment in Google Analytics:
- The URL structure for PDPs is ideal for defining a segment.
- The URL structure for PDPs is non-ideal, but it is still possible to define a segment.
- The URL structure for PDPs makes it very tough or impossible to define a segment on default.
Let’s look into each of these scenarios and the Google Merchandise Store.
1. Ideal URL Structure
Here is an example of an ideal URL structure for defining a PDP segment:
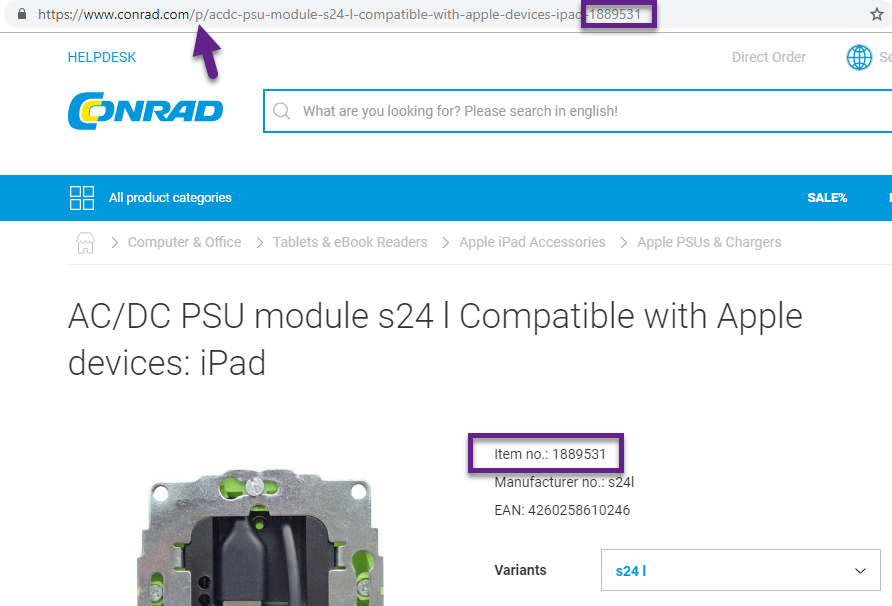
It turns out that every PDP on Conrad’s website has the /p/ identifier at the beginning and ends with the item no.
We can use this information to filter and segment on the PDPs for our analysis.
Learning how regular expressions work is very useful when working with segments. In this case we could use the following RegEx (keep it simple):
- ^/p/ -> captures all pages that start with /p/.
2. Non-Ideal URL Structure
A non-ideal URL structure doesn’t come with one, unique identifier to distinguish product pages from other website pages.
I have encountered websites where I needed to write very complex RegEx statements to capture all product pages at once. And before that I also needed to thoroughly analyze a whole bunch of URLs to demystify the actual structure.
This is something not every marketer or analyst masters.
In doubt about what to do? Make sure to talk to the dev team if you encounter such a situation. Most probably they are skilled to write RegEx statements AND at the same time know a lot about the website structure.
3. Impossible URL Structure
The Google Merchandise Store makes it (almost) impossible to extract the product page URLs with a Regular Expression.
Even complex RegEx statements like, /google\+redesign\/[A-Z]{1,15}\/[A-Z]{1,15}\+.*$, don’t do the job because of similarities in how the product page and category page URLs are built.
It would require a ridiculous long and multiple statements RegEx to get this to work!
However, we don’t have to worry as there is (almost) always a way to tackle challenges.
In this case it’s all about getting the required metadata right.
Solution 1: Content Grouping
Create a content group by tracking code.
You will need dev help here with the implementation. So that they bucket the pages in the right category where one of the groups would be “product pages”.
You can use the content group name to build a segment in Google Analytics.
Read this article if you want to learn more about content grouping.
Solution 2: Custom Dimension
In Google Analytics you can set a custom dimension at the hit, session, user and product level.
At the page level you usually work with hit level custom dimensions.
Here is how we could get this to work for the Google Merhandise Store:
- Configure a custom dimension in Google Analytics and set it at the hit level. E.g. “Page Category”.
- Fetch for each of the pages on the website the “Page Category” value via the GTM dataLayer.
- https://shop.googlemerchandisestore.com/Google+Redesign/Apparel -> Category
- https://shop.googlemerchandisestore.com/Google+Redesign/Apparel/Android+Sport+Socks -> PDP
You can use the custom dimension value “PDP” to build a segment in Google Analytics.
Read this article if you want to learn more about custom dimensions.
Solution 3: Use a Funnel Segment
You know what, there is actually another solution without having to modify the implementation! :-)
Prerequisite is that Enhanced Ecommerce is implemented correctly.
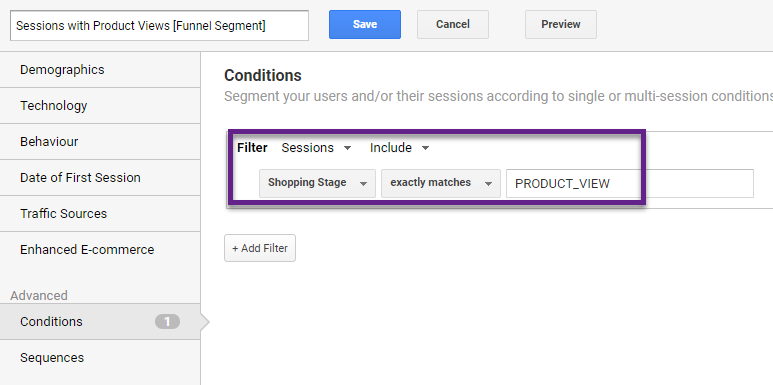
Unfortunately, you will see odd data when applying this segment:
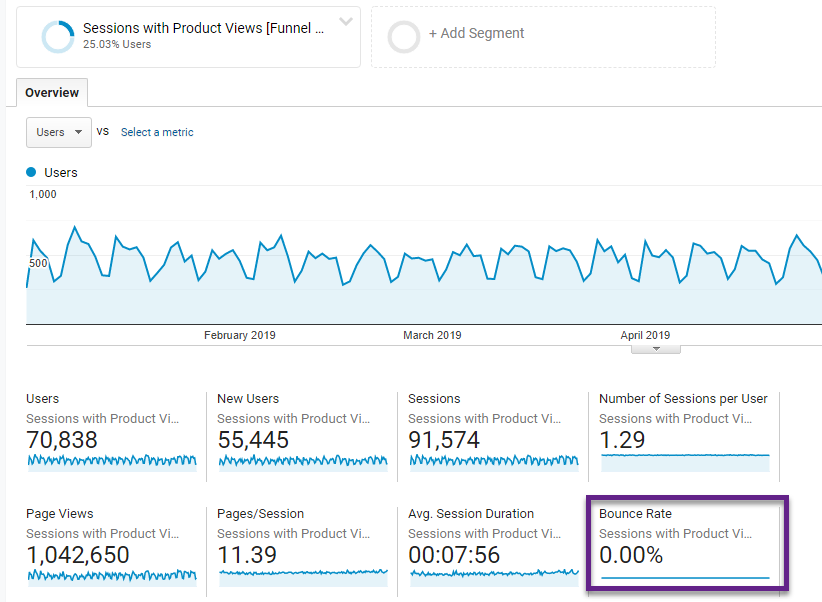
Normally, this segment also includes bounced sessions. That’s why I prefer not using it in the analysis as there might be something wrong in the implementation.
Solution 4: Mix of Page and Page Title Dimension
For the Google Merchandise Store, there is another great solution that pops up if you carefully examine the data!
All category pages have in common that the Page Title includes “|” and this is not the case for product pages. We can use that information to define the segment:
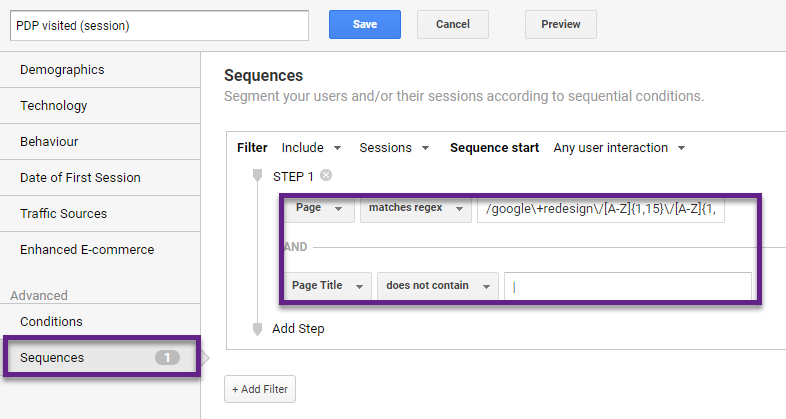
Please note that I have defined this segment as a sequential segment.
By doing this, I tell to Google Analytics to treat the Page and Page Title rule within one single hit -> hit-scoped segment!
We can use this segment for our analysis.
In the next chapters we will go deeper into segmentation and how to make a segmented analysis on product pages. The Google Merchandise Store (data Q1 and Q2, 2019) is used.
Note: it’s still a good practice to use content groupings and custom dimensions for setting up and working with certain metadata / categorizations across a wide range of reports in Google Analytics.
Session-Level Analysis
At the session-level we can make different types of analysis.
We will primariy focus on a segmented analysis on “product page sessions”. It means that we include entrances on the PDP, but not solely focus on those in a separate analysis.
The fact that the Google Merchandise Store doesn’t have a lot of direct entries on the PDP is one of the reasons for this choice.
Segment PDP = Page (Session)
Here is (again) the segment that we use:
Audience Analysis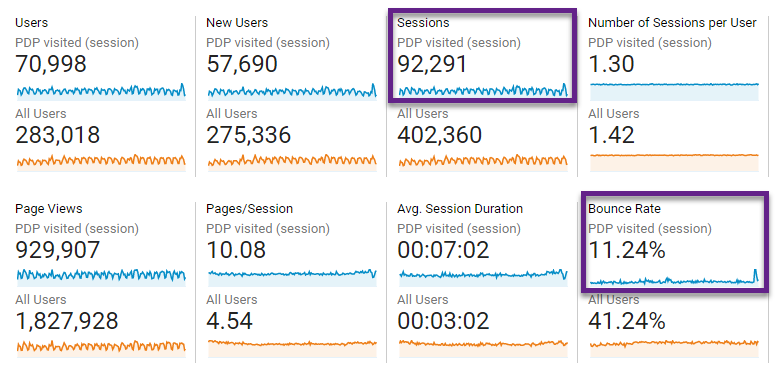
- Roughly 23% of all sessions include a PDP view.
- Engagement (in terms of pages/session and session duration) are higher for this segment compared to all users (expected).
- Bounce rate is 11%; if you look at the distribution of landing pages this is also what we would expect. Not a lot of users enter the website on the PDP.
Device Analysis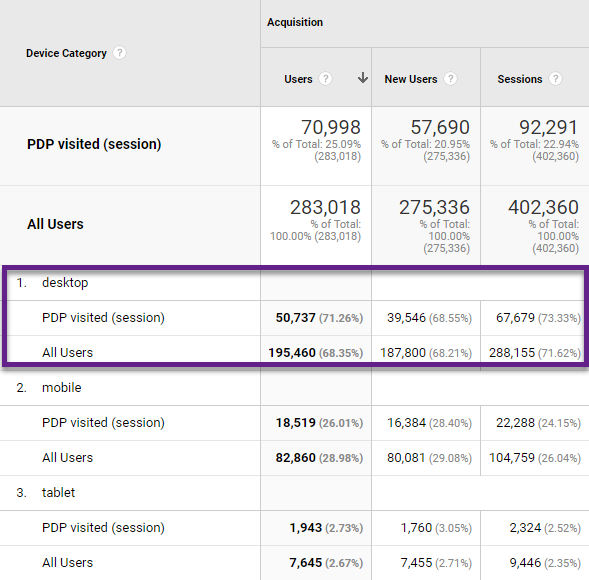
- Desktop (overall) is the major traffic source of Google Merchandise Store.
- Relatively, more desktop visitors hit a product page during a session when compared to mobile.
- Tablet is a very small player in terms of traffic to the Google Merchandise Store.
Channel Analysis
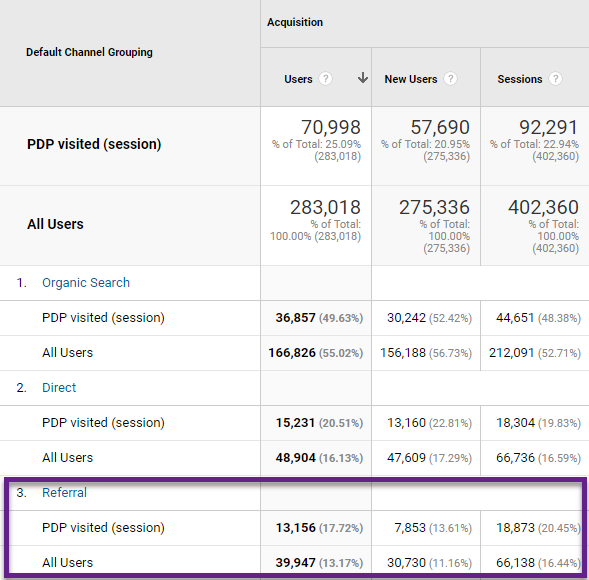
- Organic Search is both overall as well as for this particular segment the largest traffic source.
- Referrals bring relatively the most PDP sessions.
Revenue Comparison Analysis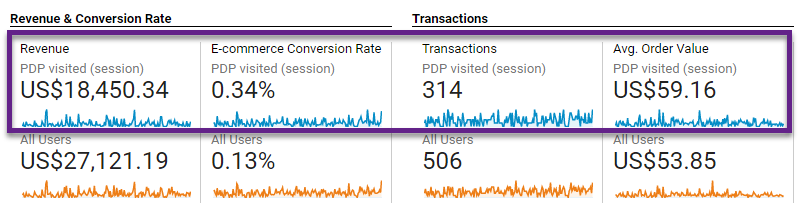
- 68% of revenue and 62% of transactions come from PDP sessions.
- Ecommerce Conversion Rate is higher for PDP sessions (more sales oriented).
- Converted PDP sessions have a higher AOV compared to overall converted sessions.
- Still, 38% of all transactions don’t fall in this segment.
A closer look at the website structure reveals a different route to purchase a product (without visiting a PDP).
This could explain a lower percentage of users interacting with the PDPs on the website before making a purchase. Especially true, since a lot of Google employees are ordering those products and this group of users doesn’t need much information before making a (cheap) purchase.
This is also a plausible reason for the lower AOV we see among all purchases as these also contain quick purchases without hitting a PDP.
Hopefully you already see the true power of segmentation in unlocking behavioral patterns on a site.
User-Level Analysis
I will keep this section short to not overcomplicate the analysis.
Once you understand session-level segmentation and analysis, it’s a great next step to dive into user-level analysis.
Keep in mind that – on default – a user-level analysis is focussed on the client ID which is unique for every browser and device. Someone visiting your site today on desktop and coming back tomorrow on mobile is not recognized as the same user.
That being said, there is another limitation here as Google Analytics caps the maximum time period for a user-level analysis (segmentation) to 93 days.
Here is how the user-level segment for a PDP included session looks like:
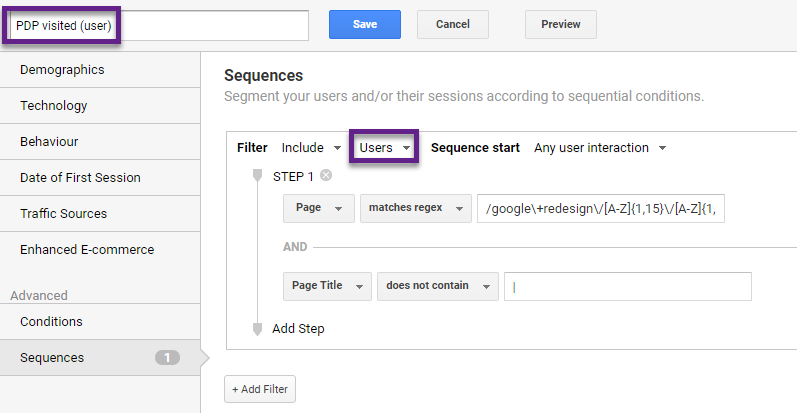
The segment definition only changes at the Filter level where Sessions become Users.
And here is the message in Google Analytics: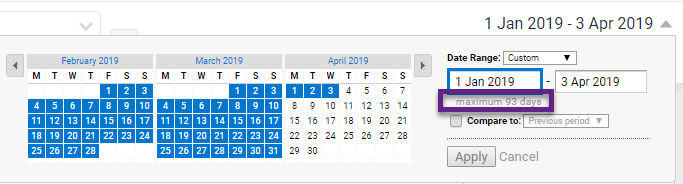
I will share one analysis for Q1, 2019 and again data from Google Merchandise Store.
Revenue Analysis (User)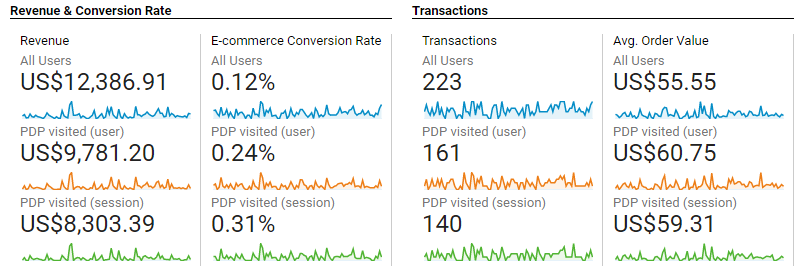 This is how to interprete the data:
- In Q1 2019, GA measured $12,387 revenue for the Google Merchandise Store with a session-level CR% of 0.12%.
- For PDP visits (sessions) the revenue is $8,303.39 and the session-level CR% equals 0.31%.
- However, if we look at users with a PDP session (and include all their sessions), the session-level CR% is a bit lower (0.24%).
- At the same time, the revenue is a bit higher, but there is not a big difference if compared to the session-level segment.
- In this case we can conclude that a small portion of transactions (21 = 161 – 140) occur through users not hitting a PDP page in converted session B, although they had a PDP hit in session A.
As you already see, applying and understanding user-level segments is a whole different ball game. Something to be discussed in another post in more detail!
Concluding Thoughts
Analyzing product page performance isn’t as simple as you might think.
First of all, you need to demystify a website’s structure and come up with the right definitions for building segments.
Then you need to apply the defined segments to the right set of reports and interprete the data in the context of the website and business situation.
Main point is that segmentation is crucial when you want to derive insights from your data. Getting knowledge and hands-on experience with regular expressions, segments and projects to work on, will get you where you want to be!
A great place to start your journey is the Google Demo Account.
Now it’s your turn! What are your thoughts on making a product page analysis? Happy to hear your thoughts!
One last thing... Make sure to get my automated Google Analytics Audit Tool. It contains 25 key health checks on the Google Analytics Setup.The post Expert Guide to Product Page Analysis in Google Analytics appeared first on Online Metrics.