Do you want to improve the ROI of your website, solve a business question or simply derive greater insights in less amount of time?
The quicker you can analyze your data and draw relevant conclusions, the faster you can act.
By doing this you can either greatly improve the positive impact or limit the negative impact in any situation.
In both cases it’s a WIN!
 In this post I will discuss 21 strategies to give your Google Analytics data analysis a real boost.
Google Analytics Data Analysis
First of all your technical implementation needs to be done correctly.
It doesn’t make sense to start any data analysis on incorrect data.
Make sure to have a good developer in-house who can support you here or hire an agency or freelancer so that everything is measured correctly in Google Analytics.
Let’s continue with a list of tips that will greatly enhance your analysis capabilities.
1. Ask a Business Question First
This is the first and probably most important tip I can give you:
“Always start your data analysis with a question.”
It doesn’t matter whether you use Google Analytics or any other web analytics tool.
How do you know where to look or what to analyze if you don’t know what to solve?
So don’t waste time with just looking around in Google Analytics.
Might be fun for a rainy weekend day, but it’s not a good thing if you really want to achieve something in less amount of time.
2. Use a Data Analysis Framework
Having a process in place is very important as well. You don’t want to reinvent the wheel every time again.
If you know how to approach a data analysis project in a smart way you should either stick to it or improve it.
One of my latests posts about 10 easy tactics to improve your data analysis might be a useful read for you.
3. Set Up Goals and Goal Values
It might sound like a no-brainer to you, but I have encountered many google analytics accounts with:
- No goals configured.
- Goals configured in an incorrect way.
- Goals configured without goal values.
You need to check these goal settings this upfront.
Make sure to have your Google Analytics goals configured correctly with a goal value attached to each of your goals.
I recommend here to not only look at your most important goal (macro goal), but also at minor or micro goals.

A simple example on Amazon.com:
- Directly selling products is a macro goal.
- Selling giftcards indirectly leads to product sales (and new clients) and is a micro goal.
Note:
- Giftcards could even be a macro goal if the average value of a gift card is higher than the average value of an order.
- Or when giftcards lead to valuable customers in the long run.
Read this post about macro and micro goals if you want to learn more about this topic.
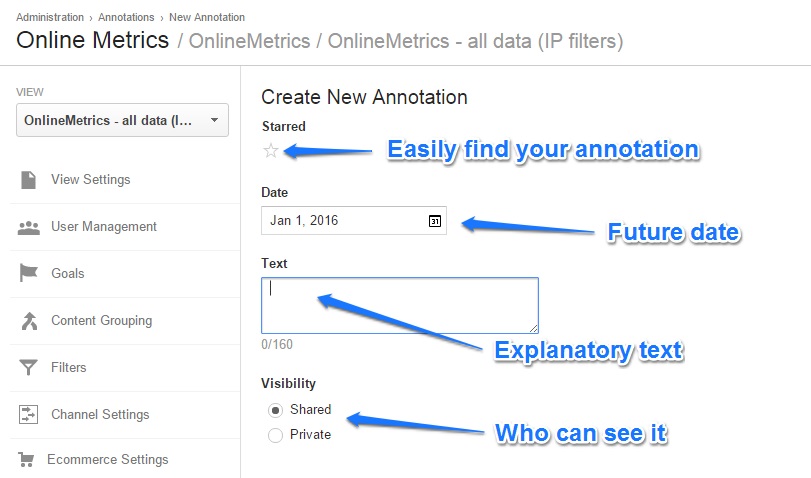
4. Set Up Annotations
Google Analytics annotations can be a tremendous help in your data analysis.
You can record many different things like:
- Tracking issues on your website.
- Offline campaigns.
- Price changes by your competition.
- Weather extremes.
- The start of new online campaigns.
- Traffic spikes in Social.
I recommend to make a note of the activities that might impact your data, but be a little bit careful here.
If you are about to add ten annotations per day, this is not going to work.
There are two ways to add annotations:
- Via the reporting interface.
- Via the admin interface.
I prefer to add annotations in the admin interface.
One great thing here is that you can add future dates. This is not possible via the reporting interface.
5. Set Up Intelligence Events
In Google Analytics there are two types of intelligence events:
- Automatic alerts
- Custom alerts
Automatic alerts are created for you by Google Analytics. They will help you pinpoint major changes in your data and underlying factors of these changes.
On the other hand, custom alerts help you to monitor custom changes within your data:
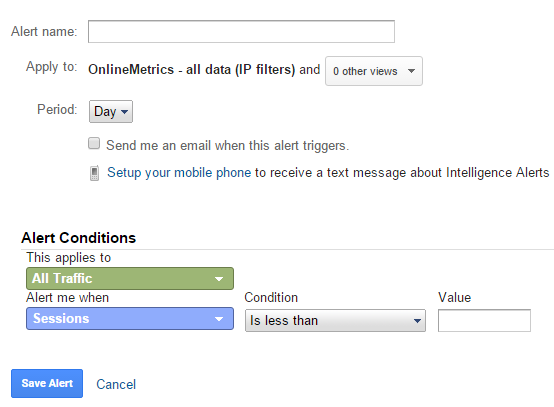
There are a few things to set up:
- Alert name: a suitable name.
- Apply to: one or more reporting views.
- Period: day, week, or month.
- Email alert: include other people who have access to this view and need to receive a message.
- Mobile phone alert: option if you live in the United States.
- Applies to: all traffic or other segment you like to apply the alert to.
- Alert conditions: specify when the alert needs to be triggered.
For your convenience, I have included a short YouTube video that shows you how to create a custom alert:
6. Add Custom Segments to Enhance Your Insights
Google Analytics counts many different segments where you can choose from.
You can always start with an overall analysis, but real insights are hidden in segments.
Here is an overview of the default segments in Google Analytics:
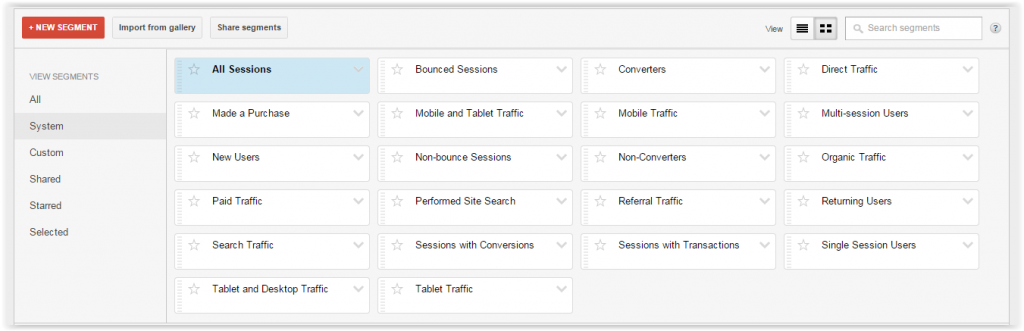 Segments help you to analyze a particular segment of your data.
It’s a very powerful method since you can apply your segments to historical data as well.
Filters are applied to the data you collect from the moment you apply the filter to your view.
Google Analytics allows you to compare four segments at the same time.
I recommend to read the following posts if you want to get the most out of segments in relation to Google Analytics data analysis:
- Complete overview of different Google Analytics segments
- How plotting rows can help you compare segments
- How to effectively set up segments in Google Analytics
- 20 Ecommerce segments to improve your customer insights
7. Automate Google Analytics Campaign Tracking
Google Analytics campaign tracking can literally make or break your data analysis.
Within Google Analytics three traffic media are measured on default
On the medium level, those are:
- (None): direct traffic via bookmarks or directly typing in a URL (or untagged campaigns that ruin your data).
- Referral: incoming (untagged) links from other domains.
- Organic: organic (unpaid) traffic via search engines.
You need to do some extra work to measure other channels in the correct way.
Google AdWords can easily be tracked by linking your AdWords to Google Analytics account.
But what about:
- Affiliates
- Paid banners
- Offline campaigns
- …
It can all be tracked by using the following Google Analytics parameters after the base landing page URL:
- Campaign Source (utm_source)
- Campaign Medium (utm_medium)
- Campaign Term (utm_term)
- Campaign Content (utm_content)
- Campaign Name (utm_campaign)
Here is a Google Analytics Campaign Tagging Tool that can be really helpful for automatically generating links.
Further I have written an extensive post on this topic you should check out as well!
If you are completely new to this topic you might want to watch this video:
8. Automate Google Analytics Reporting
It’s important to report on the main KPIs of your business. However, you should minimize the time that it takes to build your report!
A lot of companies still need to make a switch from 80/20 to 20/80 in terms of reporting vs. analysis.
How do you work with your Google Analytics data? Do you export your data and analyze it in Excel or via another statistical package?
Transfer your data to an environment where you can easily manipulate and analyze your data set. This will greatly speed up your analysis.
I recommend you to learn how to automate your Google Analytics data export.
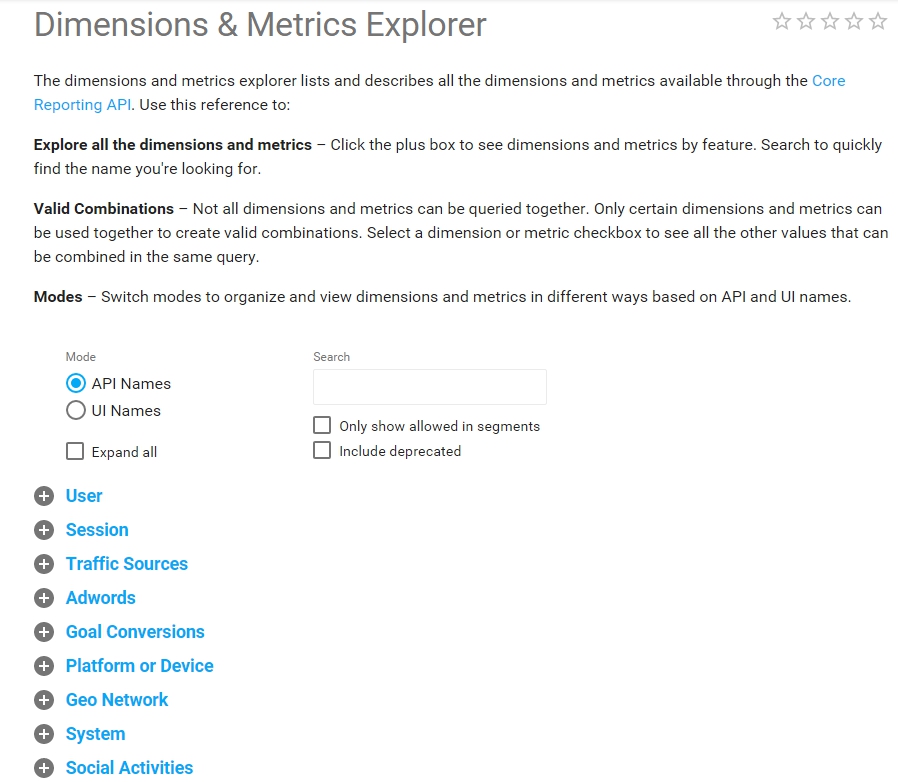
9. Learn All About Metrics and Dimensions
Metrics and dimensions are the building blocks of (almost) every report in Google Analytics.
Not all metrics and dimensions go together.
Play with them, find out what works well and what doesn’t work.
Make sure to save your favorite templates for later usage.
I recommend to check out the Metrics & Dimensions Explorer. It will help you to quickly master them.
10. Build Powerful Custom Reports
Every business is different and has its own goals and KPIs.
Custom reports are directly related to metrics and dimensions. And they allow you to build reports from scratch or combine standard reports within one custom report.
It’s easy to create custom reports via the “Customization” tab in Google Analytics:
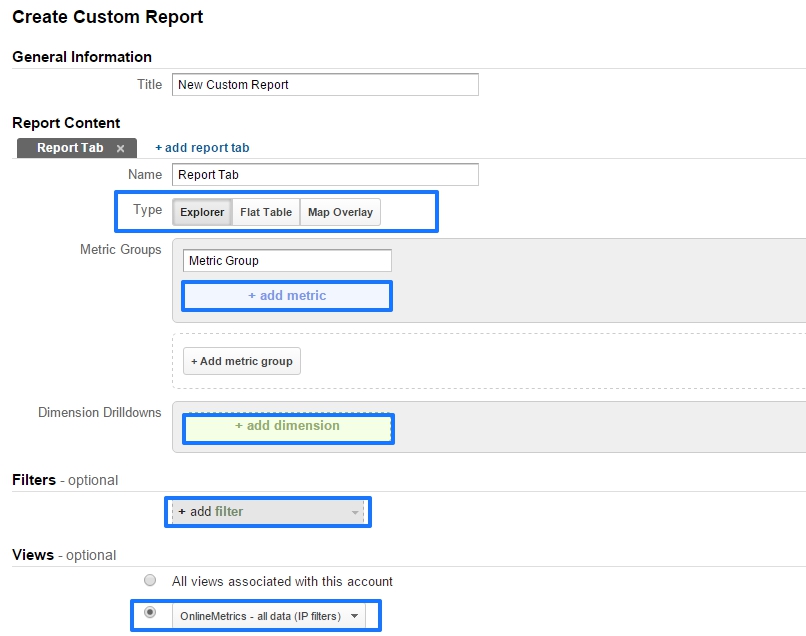 A few things you need to choose:
- Report type: explorer, flat table or map overlay.
- Metrics: your desired metrics.
- Dimensions: your desired dimensions.
- Filter: pre-filter your data (optional).
- Views: the views you want to add this report to.
Custom reports that are focussed around your data analysis are really helpful to make your life as a web analyst a lot easier!
11. Learn to Use Regular Expressions
Regular expressions are very powerful in Google Analytics. And I highly recommend to learn all about them.
They can assist you in:
- Effectively filtering your report data.
- Setting up filters.
- Setting up goals.
- Defining funnel steps.
- Setting up segments.
Check out my ultimate guide to regular expressions if you want to excel in this area!
12. Integrate with Other Tools
Integrating Google Analytics with other tools will greatly enhance your data insights.
At a minimum I recommend to integrate Google Analytics with:
- Google Webmaster Tools.
- Google AdWords (if you are an advertiser).
I have performed a search on “integrations with Google” and within the first 30 results the following products appear:
- Optimizely
- Add This
- VWO
- Olark
- Wistia
- Unbounce
- WordPress
- Mailchimp
- Freshdesk
- LiveChat
- Formstack
- Segment
- Usabilla
- Brightcove
- Gleam
Bringing your data sets together is a great step in optimization!
Review this top 10 list of Google Analytics integrations if you want to learn more.
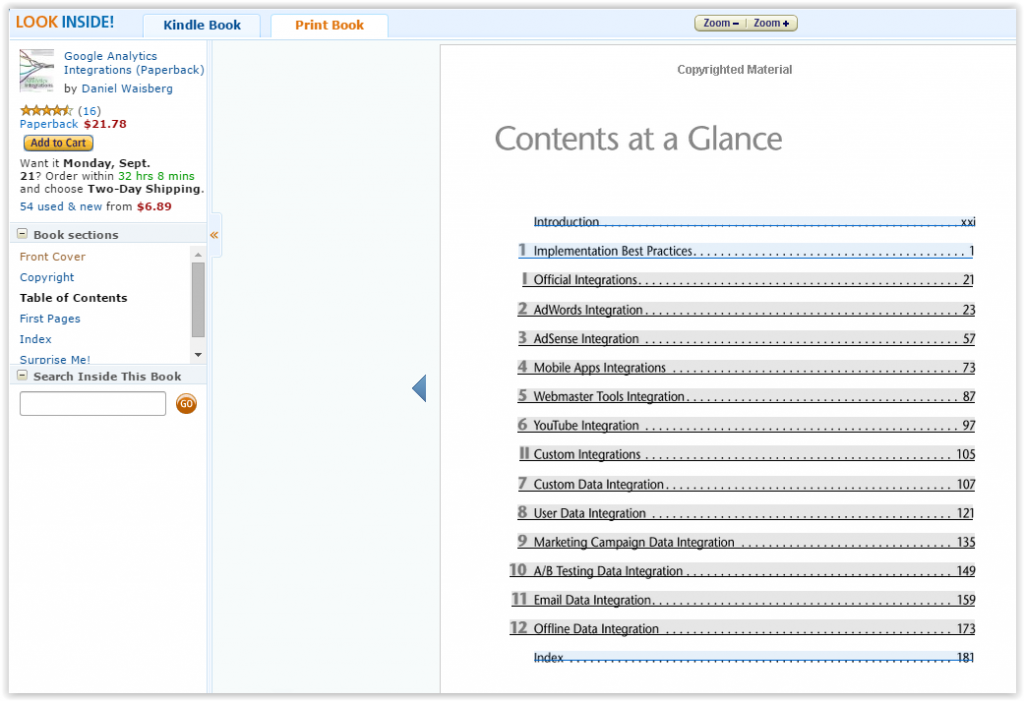
Daniel Waisberg has published a very comprehensive book you might want to check out as well!
13. Use Pre-Built Dashboards for Generating Ideas
In my opinion Google Analytics dashboards definitely need to be improved in many different areas.
However, they can still be effective if you set them up in the right way.
You don’t want to miss these resources if you need some inspiration for setting up your dashboards in Google Analytics:
- Google Analytics Solution Gallery (includes custom reports and segments as well).
- Dashboard Junkie.
Once again, you can definitely save time that you can invest in data analysis and website optimization instead.
14. Do Your Work in Multiple Windows
It’s easy to remove a report filter, close the reporting tab or perform any other unwanted action.
Here is my suggestion to overcome this Google Analytics issue:
- Copy the URL of your report.
- Open another tab or window.
- Paste the URL.
This is especially helpful if you perform a deeper analysis with advanced table filters or regular expressions.
You can also use this technique if you want to analyze shorter time intervals in multiple windows because of sampling.
15. Enlarge Your Reporting Screen
Your reporting screen in Google Analytics can be customized to your needs.
In most cases you might want to leave the navigation bar (on left side) open.
However, when performing your data analysis, you might not want to be distracted by other elements.
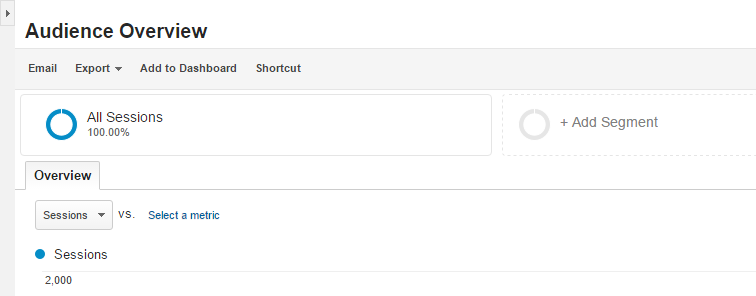
On top of the screen there is a short arrow:
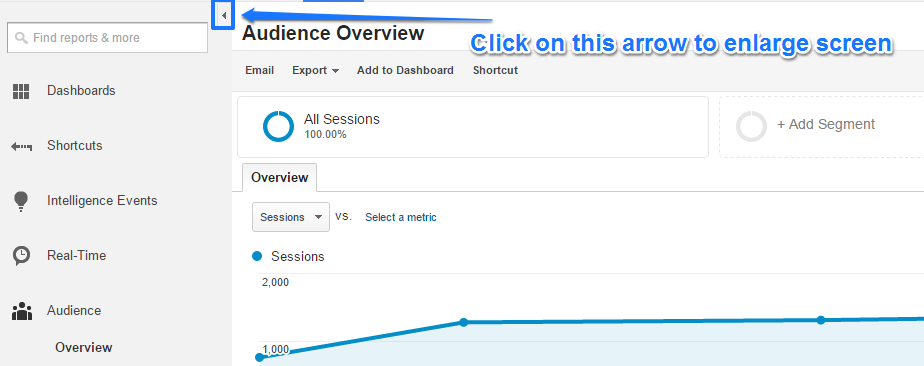
You can click on this arrow to make the navigation bar to disappear:
 It can be very useful:
- When analyzing a huge amount of data in Google Analytics (and especially when 3+ dimensions and different metrics are combined in a custom report).
- When being on stage or doing a Google Analytics workshop (and you don’t want to be distracted).
Note: you can also hit “m” to enlarge your screen; hit it another to return back to the original setting.
16. Apply Keyboard Shortcuts
You can make some modifications to your Google Analytics data by using smart shortcuts.
Get the shortcuts overview on your screen by typing a question mark (?):
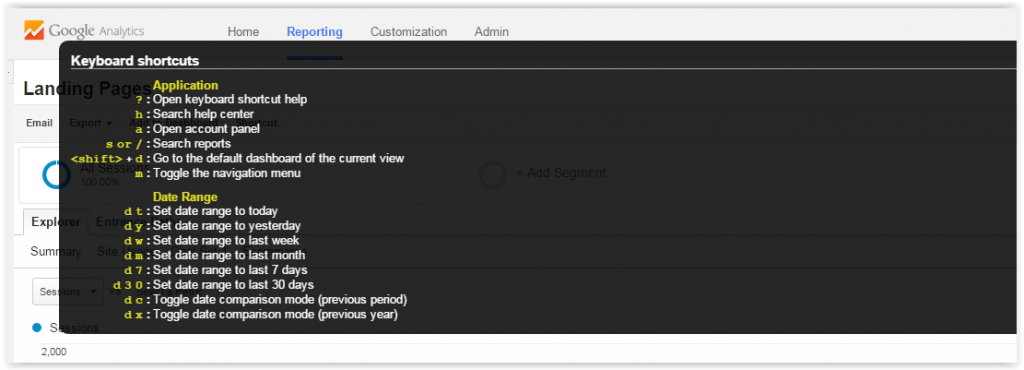 On a regular basis I use the data range shortcuts.
It’s a helpful and quick method to get an idea of how a website performs in a specific period.
17. Apply Report Shortcuts
The Google Analytics Shortcuts feature can be really helpful.
It is clearly explained how to set this up on the support pages of Google:
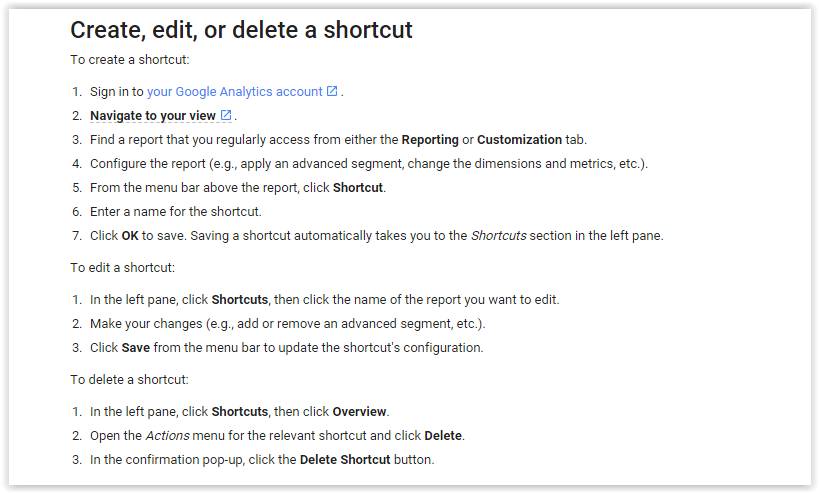 In my experience this is a useful feature for everyone who works with Google Analytics.
For a consultant – who is often involved with many different websites – it is really, really handy!
18. Use “Find Reports & More” Module
Instead of using the navigation bar, you can directly search for your favorite report in the search bar.
You can find it on the upper left side under “Find Reports & More”:
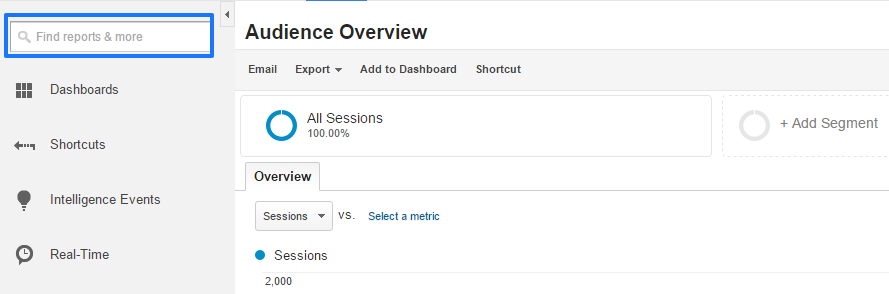 Via this feature you can search for:
- Standard reports
- Custom reports
- Saved shortcuts
You will find this search box to be very helpful.
Especially if you are an advanced Google Analytics user and have memorized the names of many reports and shortcuts in Google Analytics.
19. Use Real-Time Reporting
Let’s assume you are employed at a large company. And they like you to quickly analyze a new online campaign.
You need to look at the “normal” reports (or automate your data export) to get the most accurate view of campaign performance.
However, real-time reports are really useful if you want to get a quick peek into how things are going.
Example:
- You have set up a specific goal for your online campaign.
- Navigate to Real-Time in Google Analytics.
- Click on Conversions.
- Select the goal that applies to your online campaign.
The following report gives you a clear indication of the campaign performance in the last 30 minutes.
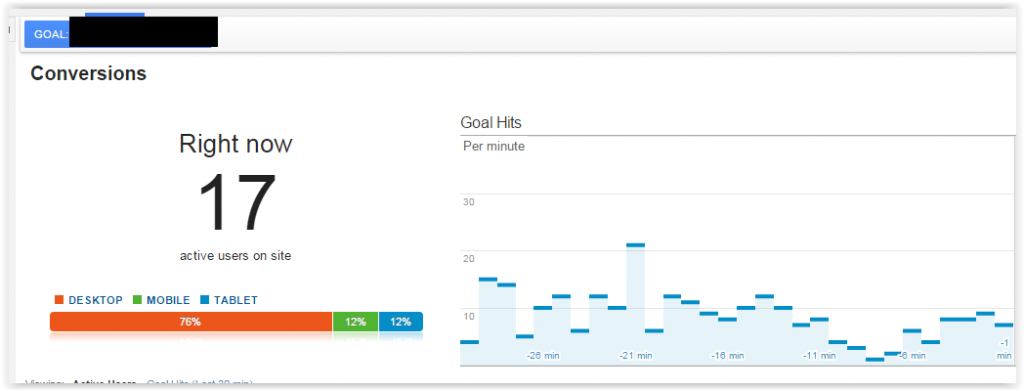 Your site needs to have a substantial amount of visitors and conversions to make this report useful for real-time campaign performance monitoring.
Besides that it will help you quickly spot any issues in your campaign tracking.
20. Ask Questions
Do you need some inspiration for solving the puzzle?
You will get a lot of useful feedback by asking smart questions to either your client, a colleague or even a friend.
Place the analysis in the right context and you will do much better. And don’t be afraid to ask too many questions. It won’t happen!
It doesn’t only apply to web analytics, but to all areas in life.
Asking questions is crucial for personal growth.
21. Get a Break
Do you recognize sometimes getting stuck while performing your data analysis?
You can’t work effectively for a few hours without taking a break. Many people think they can, but in my opinion it’s definitely not true.
A great technique Neil Patel mentioned on his blog is the so-called Pomodori Technique.
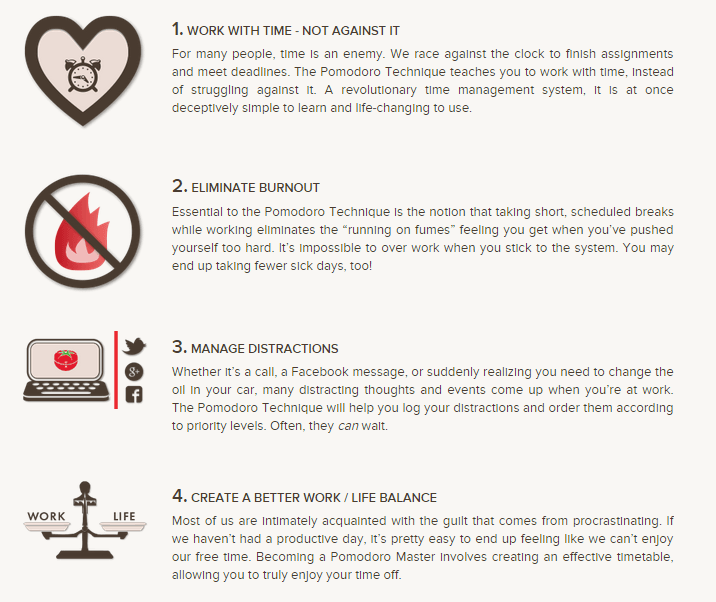
Find out how you can apply the Pomodori Technique to your next data analysis project:
- Decide in advance what you want to solve.
- Set the timer to 25 minutes.
- Work on the task with full concentration until the timer rings.
- Take a short break (3–5 minutes).
- After four 25-minute sessions, take a longer break (15–30 minutes).
It will keep your stress-level low and has a very positive impact on your analysis. Your mind and body will be grateful.
Try it and let me know whether it works for you as well!
I hope you have learned some new things to speed up your next Google Analytics data analysis. Do you have any additional tips you like to share?
I am sure you will love my new eBook if you enjoyed reading this article!It contains 100 actionable tips to grow your online business.
Analytics & Optimization Tips eBook and Free Updates
 (Your email address is 100% safe with us)
The post 21 Tips to Improve Your Google Analytics Data Analysis appeared first on OnlineMetrics.