Are you stuck in your A/B testing tool when analyzing the results? You are missing out a lot of great insights if you keep your nose in just one tool.
Over the last years I have seen many companies run A/B tests via Optimizely, VWO, Test & Target or even directly in GTM.
One crucial thing that I have learned: integrate your testing tool with a web analytics tool.

Last week I read this article on the Convert blog.
Will Google Optimize be the future of A/B testing? We will see.
In this post I reveal five steps in Google Analytics that are a tremendous help in analyzing and optimizing on the outcome of your A/B tests.
For the purpose of the article, I use the integration of Google Tag Manager and Google Analytics as an example.
Step 0: Prepare Your Test
Step zero: prepare your test set up first.
At least take into account the following points:
- Find conversion-focused pages for your next A/B test.
- Create a smart hypothesis based on data and psychology.
- Determine the sample size and find out how long the test needs to run.
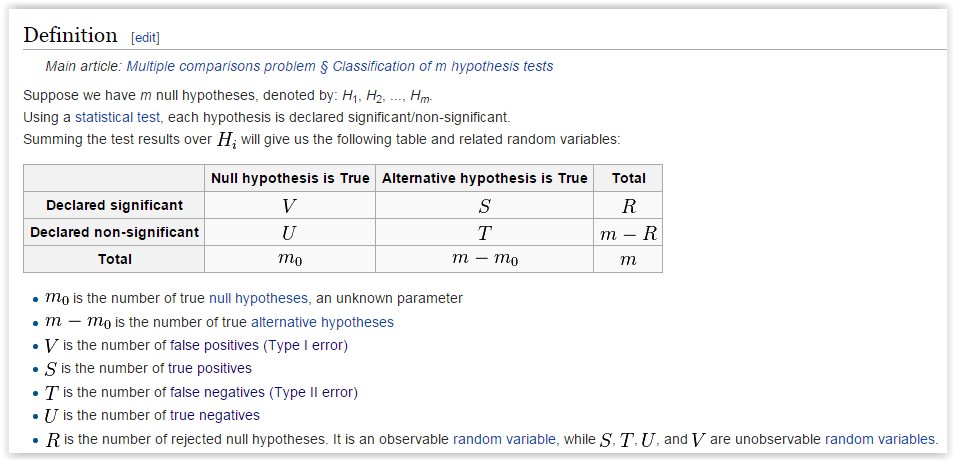
- Discuss about power (false negative) and significance level (false positive).
- Design one or more test variations.
- Code your test variations.
- Test your set up.
Step 1: Capture A/B Test Data with GTM
As a first step you need to make sure to integrate your testing tool and/or Google Tag Manager with Google Analytics.
A very efficient way is to use the event tracking feature in Google Analytics.
Last year I was at the conference Conversion Hotel.
Analytics & Optimization Expert Jules gave a great presentation on how to get this to work.
Check it out below:
Do you use Optimizely for running your A/B tests? Read this guide on integating Optimizely with Google Analytics via Custom Dimensions.
VWO has a similar guide on this topic you could check out as well.
Step 2: Check Your Real-Time Reports
You can see within minutes after you start your A/B test whether things work smoothly or not. Head over to real-time reports and take a look under events:
![]() It depends on how you have named your variations, but this is where you should quickly see data showing up.
It depends on how you have named your variations, but this is where you should quickly see data showing up.
Here is a suggestion on how to name your events:
- Event category = AB-Test
- Event action = [name of variation]
- Event label = either 0 (default) or 1 (variation)
Make sure to use naming conventions when you set this up.
Step 3: Build Powerful Custom Reports
On default, events are shown within the event report. An example is given below:
![]()
The problem here is that you are not evaluating your A/B test on the user level. You are looking at “plain” events.
Building a custom report is a great solution here.
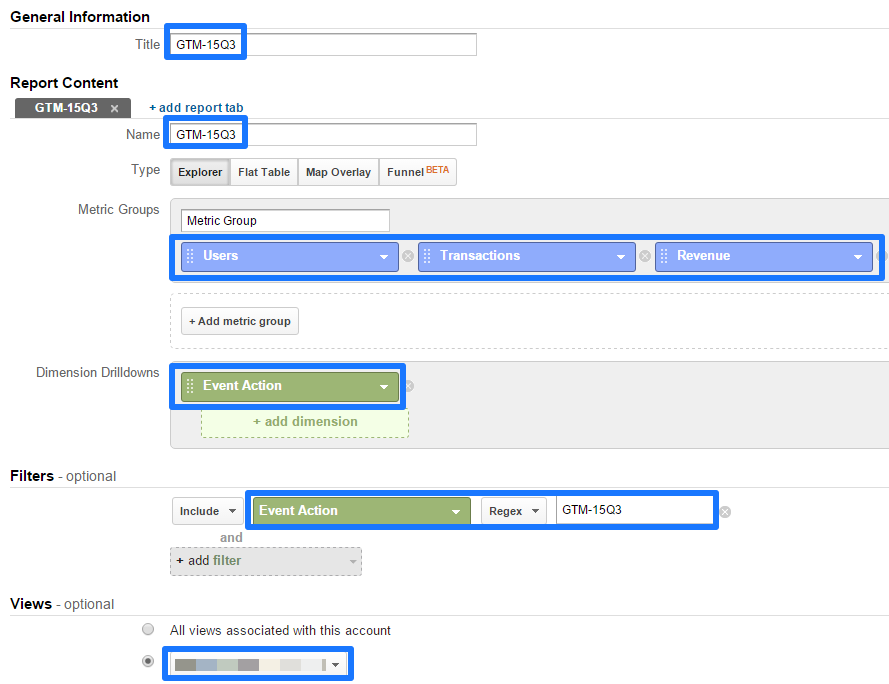
A few things to note here:
- Use goals instead of transactions if you are optimizing on a non-ecommerce site.
- In case of a non-ecommerce site forget about revenue.
- Add a title that suits your test.
- Changing the report table is optional.
- Add a filter on the event action that is connected to your test.
- Decide on adding this custom report to one or more reporting views.
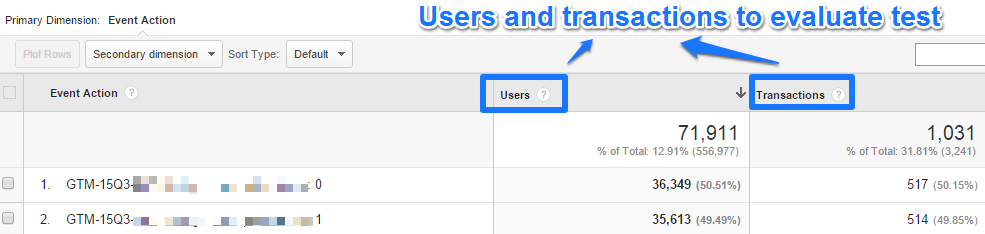
An actual report based on users and transactions looks like this:
You are not there yet.
If you want to evaluate on number of buyers instead of transactions, you need to transform the transactions into a user based metric.
Add one extra segment to accomplish this: sessions with transactions.
Note: read this in-depth post on segmentation if you are not familiar with segments.
The report looks like this after you add the segment sessions with transactions:
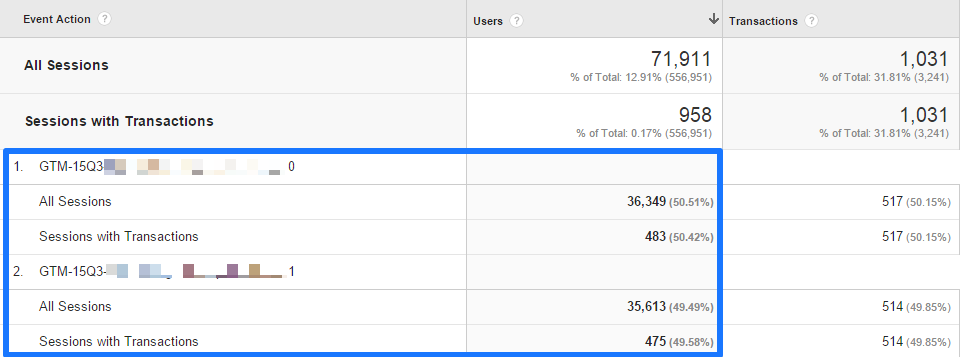
Results:
- Default: 36.349 users and 483 transactions.
- Variation B: 35.613 users and 475 transactions.
Statistical evaluation of a test is something for a future post, but this test looks inconclusive! :-)
Step 4: Dig Deeper via Segments
It depends on the actual test and context on which segments you want to drill deeper.
Here is an example of further segmenting on device category:
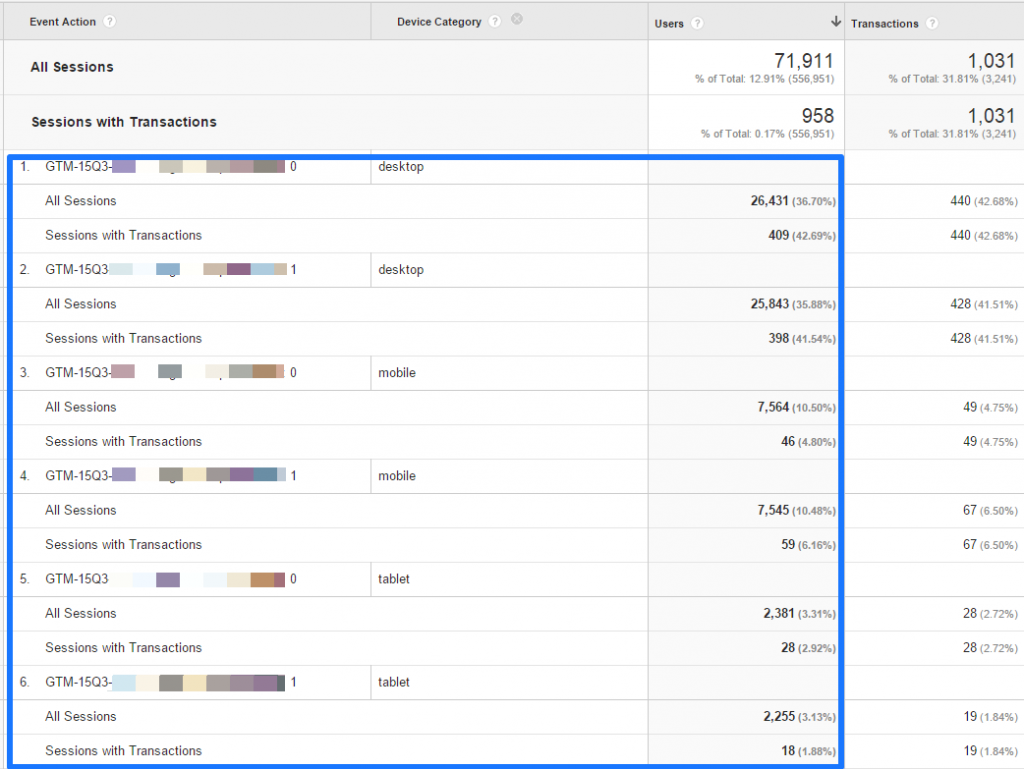
Now it’s possible to judge your test performance on multiple devices.
Note: don’t draw conclusions on very low numbers. Keep 300 to 500 transactions per variation per segment as a minimum.
Other segments/dimensions that are interesting to analyze:
- Traffic source
- Landing page
- Type of user (new or returning)
- Recency (days since last visit)
- Region (cultural differences)
Tip: use sequential segments to analyze navigational behavior differences.
Step 5: Leverage Shortcuts
Let’s assume you have created a few custom reports and applied segmentation.
What if you want to review these reports (including applied segments) at a later stage?
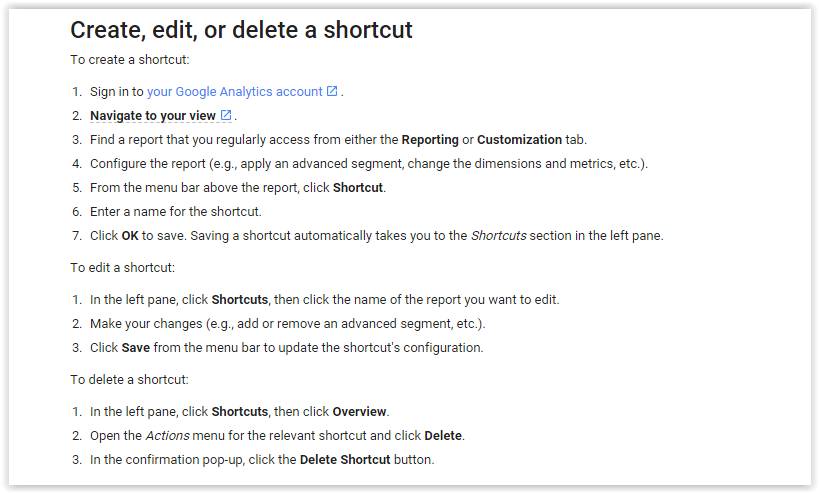
Shortcuts are the solution here.
It is clearly explained how to set this up on the support pages of Google:
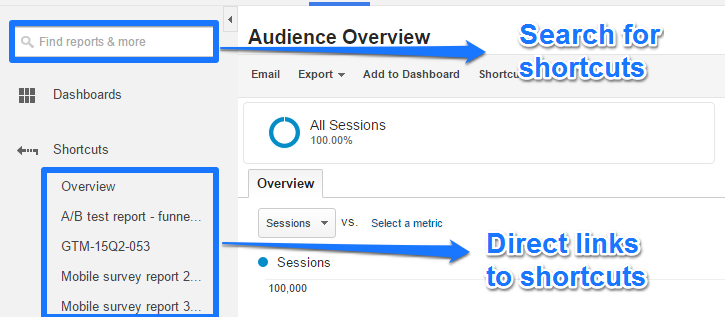
You can find your shortcuts in the reporting interface:
 Well, I hope you are inspired to analyze your next A/B tests at a deeper level after reading this post!
Do you already integrate your A/B tests with a web analytics tool and how? Happy to hear your thoughts!
I am sure you will love my new eBook if you enjoyed reading this article!It contains 100 actionable tips to grow your online business.
Analytics & Optimization Tips eBook and Free Updates
 (Your email address is 100% safe with us)
The post Five Steps to Effectively Analyze A/B Tests in Google Analytics appeared first on OnlineMetrics.