Getting the default Enhanced Ecommerce implementation working is great, but can you fully optimize on revenue and conversion rate metrics? I have discovered a smart way to enhance your revenue metrics with the gross profit metric.
Would you prefer more revenue and a lower profit margin or does less revenue and a higher profit margin sounds better?
In general these factors contribute to a more healthy business:
- A higher profit margin per product.
- A higher quantity of products sold with good profit margins.
- More repeat purchases.
- Less churn on your customer base.

In this post I will explain the concept of calculating gross profit metrics in Google Analytics in all depth.
Although it might sound daunting at first, it’s not that difficult to implement.
Table of Contents
- Gross Profit vs Revenue
- Add Custom Metric
- Import COGS Data
- Advantages of Data Import
- Test Custom Metric
- Calculate Gross Profit
- Build a Custom Report
- Optimize Ecommerce Performance
Gross Profit vs Revenue
By default – and after implementing (enhanced) ecommerce – Google Analytics equips you with different revenue metrics.
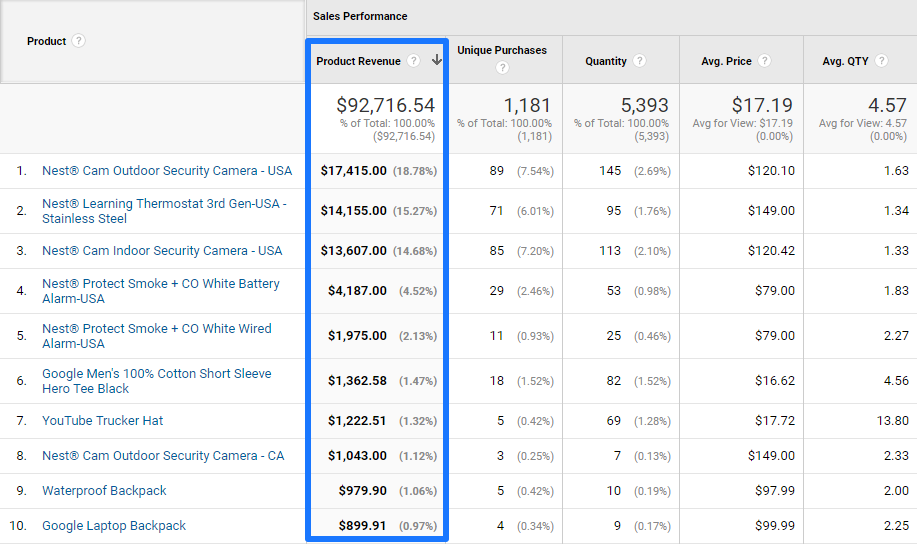
Product Revenue
Transaction Revenue
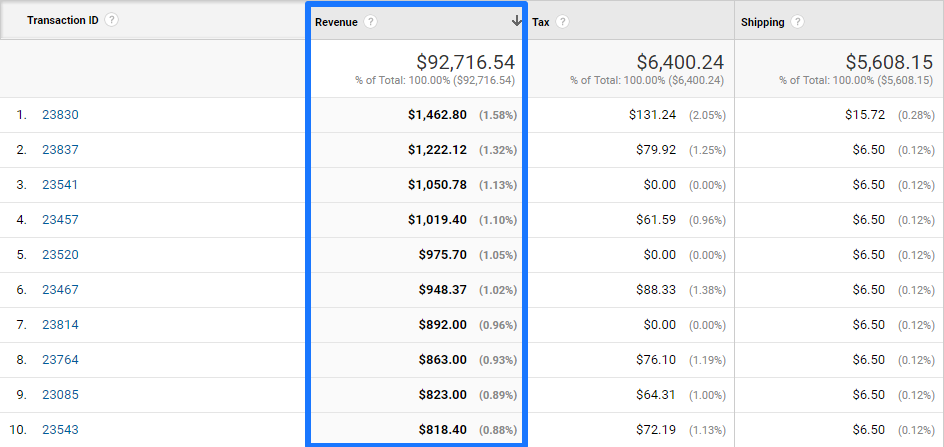 Here is a quick example on the importance of gross profit data.
An online retailer is selling televisions. The average profit margin on a TV ranges from 10 to 20%.
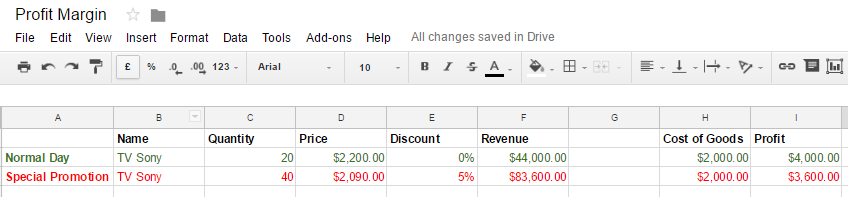
- Profit margin is 10%.
- Discount special promotion is 5%.
- Sales is increased from 20 TV’s to 40 TV’s.
- Gross profit is decreased with $400.
You would have evaluated this campaign in an entirely different way if you would only look at revenue numbers.
I hope by now you understand the Cost of Goods Sold (COGS) metric is very important to take into calculation as well.
Here are two product profitability calculations to keep in mind:
- Gross Profit = Revenue – Cost of Goods Sold
- Gross Margin (%) = (Revenue – Cost of Goods Sold) / Revenue * 100%
Add Custom Metric
The first phase in working towards getting profit data in Google Analytics, is by setting up a custom metric in Google Analytics.
There are three types of metrics in Google Analytics:
- Default Metric: available in all Google Analytics accounts.
- Custom Metric: 20 (200 in GA 360) available in each Google Analytics property.
- Calculated Metric: 5 (50 in GA 360) available in each Google Analytics view.
Please note that you can’t apply custom metrics to historical data.
On the other hand, calculated metrics can be applied to all data including historical data. This is really powerful!
The Gross Profit product metric is our final goal, but first we need to set up a Cost of Goods custom metric.
Step 1: navigate to admin interface.
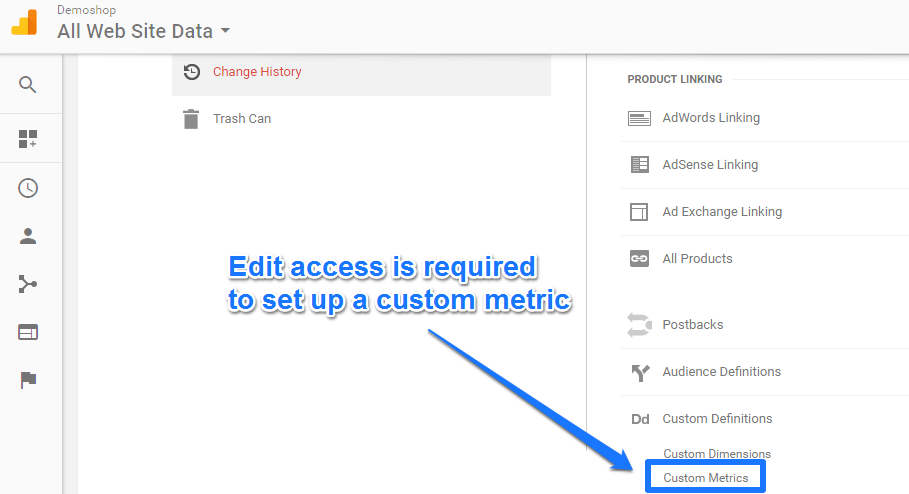
Step 2: create a custom metric.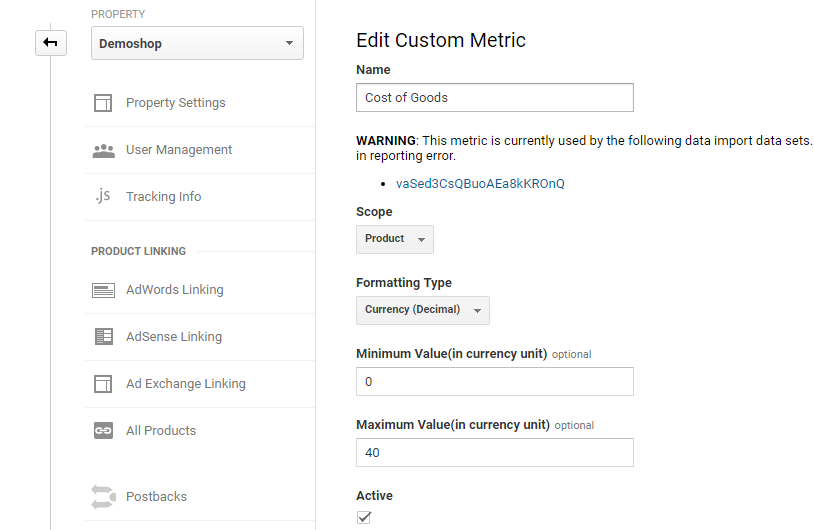
- Name: Cost of Goods.
- Scope: Product, in other cases you might want to choose “Hit” level scope.
- Formatting: Currency is the right choice.
- Minimum Value: 0, as Cost of Goods can’t be negative.
- Maximum Value: 40 in this case; I recommend to set this value to prevent the negative effects from mistakes with comma’s or dots.
And you’re done with this step!
Import COGS Data
You have multiple options in getting Custom Metric data in Google Analytics.
Here are two ways to deal with this:
- Use the Data Import functionality to (automatically) import certain data.
- Implement the custom metric hardcoded or via GTM on your site.
The second method can be great, but only if you pass non-sensitive data into Google Analytics.
In this case I want to be careful as I don’t want the competition to become suspicious after debugging my Analytics implementation. :-)
That’s why I choose for the savest way and use the data import functionality.
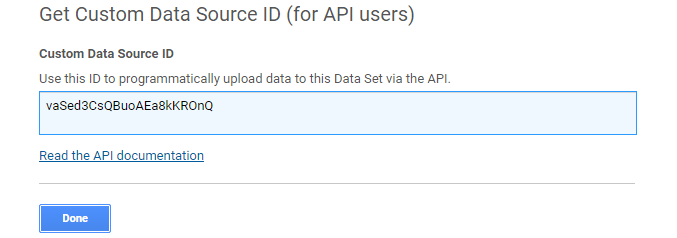
Step 1: set up your data set schema.
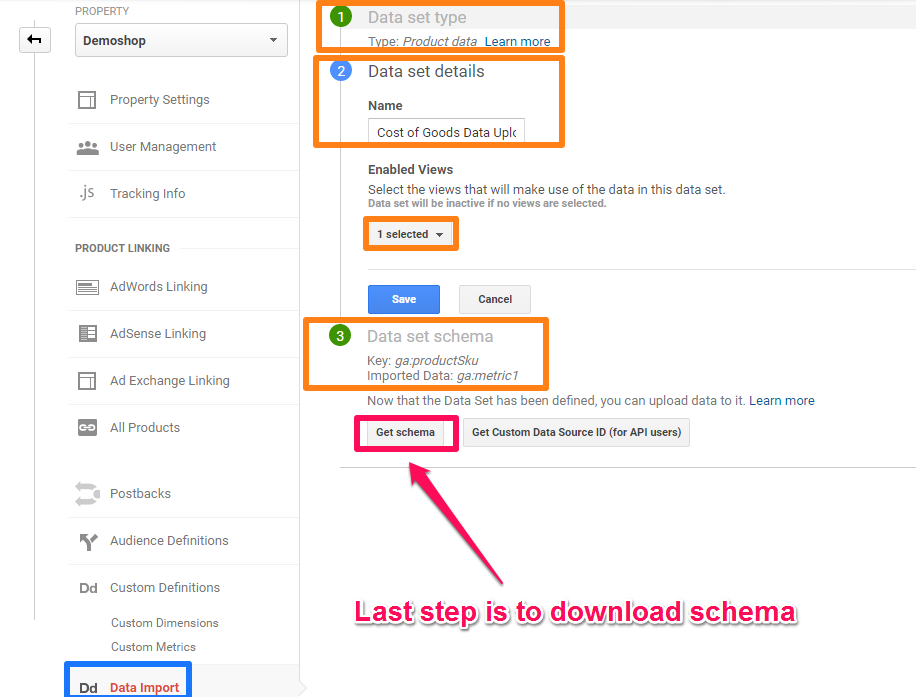
Step 2: download schema.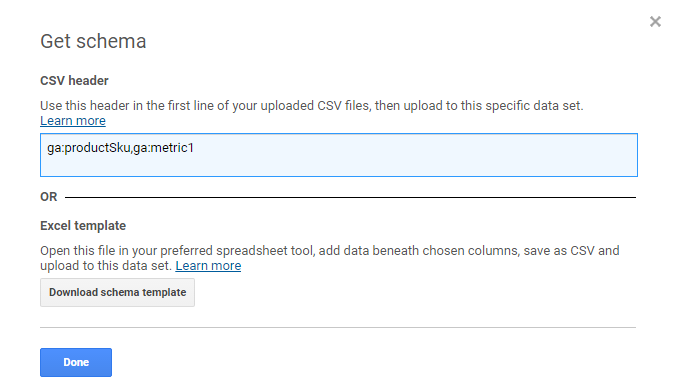 Here you can read more about specific rules for your data import.
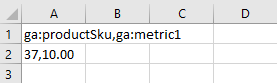
- ga:productSku = product SKU.
- ga:metric1 = custom metric #1 (in our case: Cost of Goods).
Instead of manually uploading this data, you could opt for an automated way. This is especially useful if you are dealing with thousands of products and a lot of changes in your assortment. If that’s the case, you need to use the API functionality to automatically upload the data.
 There are a ton of tools out there that can help you automate this process.
Step 3: manually upload your data scheme.
I have filled in just one SKU and the Cost of Goods value for demonstration purposes:
And as you can see, Google Analytics has accepted my data import:
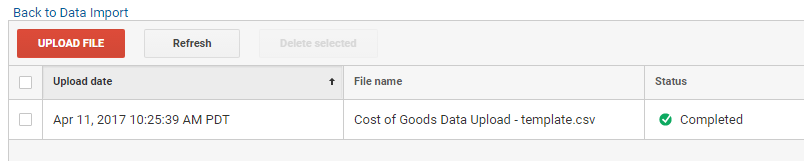 Please note that it might take up to 24 hours before your custom metric data becomes available in Google Analytics.
Advantages of Data Import
By now you understand how the process works and why you should use the data import functionality to import the COGS metric in Google Analytics.
Analytics has two main ways of gathering data:
- By sending hits collected by the JavaScript tracking code or (mobile SDK or Measurement protocol).
- By using Data Import functionality.
There are a few reasons why you would want to refrain from the default data collection method (option 1):
- Augmenting hit data requires extra time and a knowledgeable developer to write custom code.
- The data is sensitive, so you don’t want to send it in clear text.
- The amount of data is large, so you don’t want to append it to each hit.
- The data is not available when the hit occurs.
Test Custom Metric
You have set up your Custom Metric in Google Analytics, but there are still a few steps to take.
There are two important things to note:
- Custom metrics are not directly visible in your default reports.
- You (and your competitors) cannot debug the metric as we have used the data import function to convey the data.
It means you can do a test transaction and wait for some time to see whether your custom metric data is coming in.
Here is my recommendation:
- Start with a manual upload of one SKU and the custom metric value.
- If it works, you can either decide to add a list covering all of the SKU’s or start experimenting with automating this process.
Keep in mind that data import automation should only be applied after you know that it all works propertly.
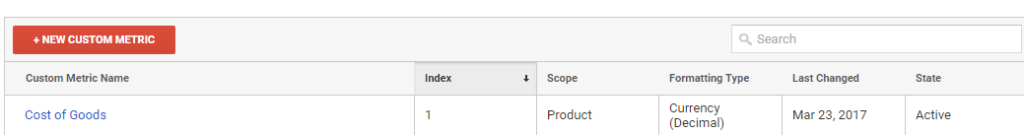
A simple trick to review your Custom Metric:
Step 1: navigate to “Product Performance” report.
Step 2: click on “Customize” report.
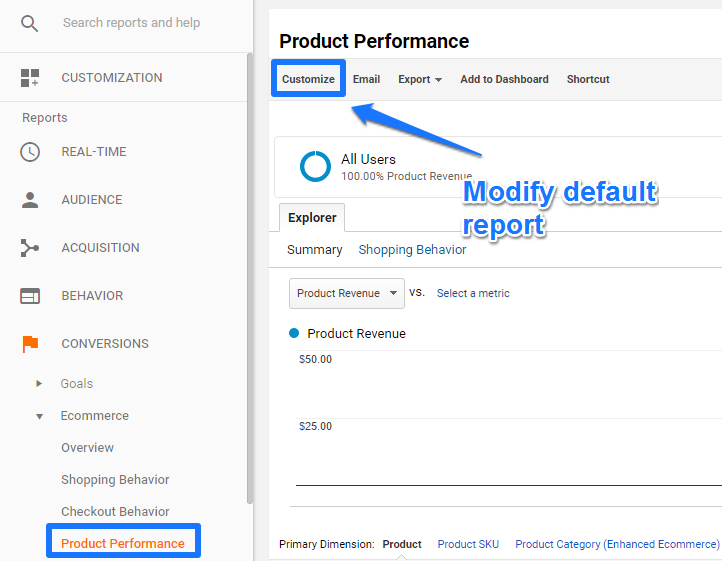
Step 3: Include “Cost of Goods” in custom report.
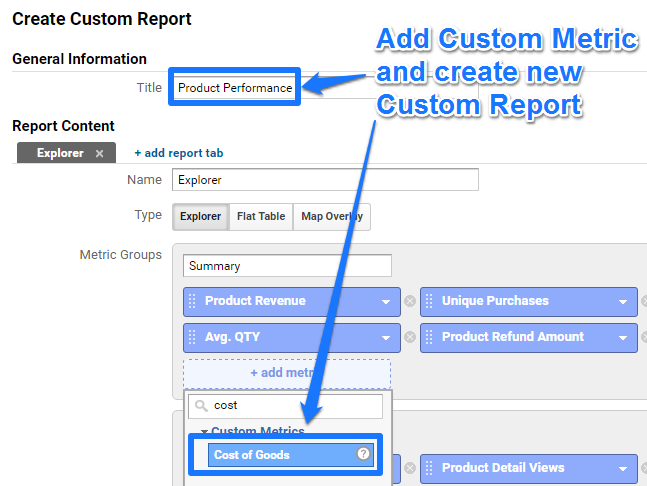 Save the report once you are satisfied with the custom report setup.
This allows you to quickly review the Custom Metric “Cost of Goods”.
Inflated Numbers
Great feedback from Analytics Expert Zorin Radovančević and the Analytics Ninja:
“I remember having issues when widening on a metric such as COGS in your case – will it not inflate the metric on each hit where product sku is present and not only for the purchase action?”
And this is true, it definitely can cause issues where the COGS is inflated in your reports.
Solution
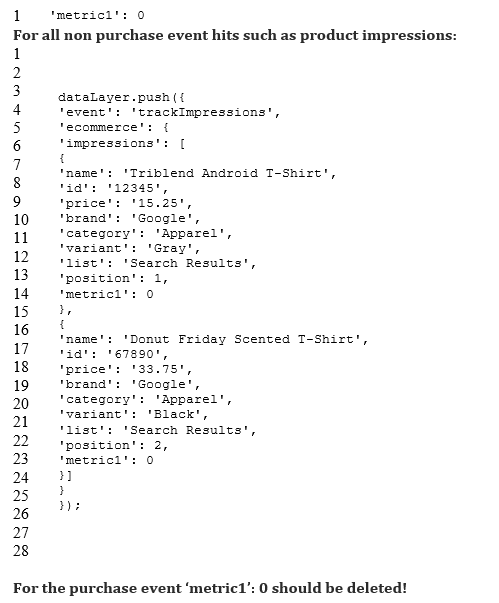
It requires you to set the custom metric (metric1 in this case) to zero within each Enhanced Ecommerce payload for all products expect the one on the purchase action. And you would want to implement this via the dataLayer.
Calculate Gross Profit
There is one more important step to take: setting up a calculated metric!
You want to judge your product performance based on gross profit instead of product revenue.
Characteristics of ecommerce products:
- Products often vary in price due to promotions / changes by competitors.
- Cost of Goods (of one individual product) tend to be rather stable of time.
This is why you don’t want to directly upload a “gross profit” metric in Google Analytics.
Instead you can calculate the metric which takes into account fluctuations in price and product revenue.
The setup is rather easy:
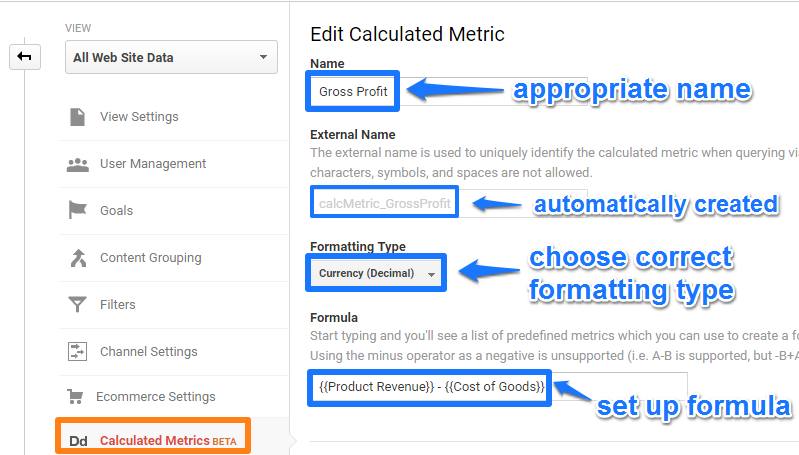
In the Formula you don’t have to type in the curly brackets by yourself.
Just search on “Product Revenue” and “Cost of Goods” (name Custom Metric) and Google will do the rest.
The beauty of Calculated Metrics is that they work retroactively! It means that you can apply the Calculated Metric to historically collected data in Custom and Default Metrics.
Build a Custom Report
I have already shown how to build a custom report with the “Cost of Goods” metric.
Now the “Gross Profit” metric is also available, you should slightly modify your earlier created report.
Here is a direct link to a Custom Report that incorporates both metrics. Make sure to save it in the appropriate views and you are good to go.
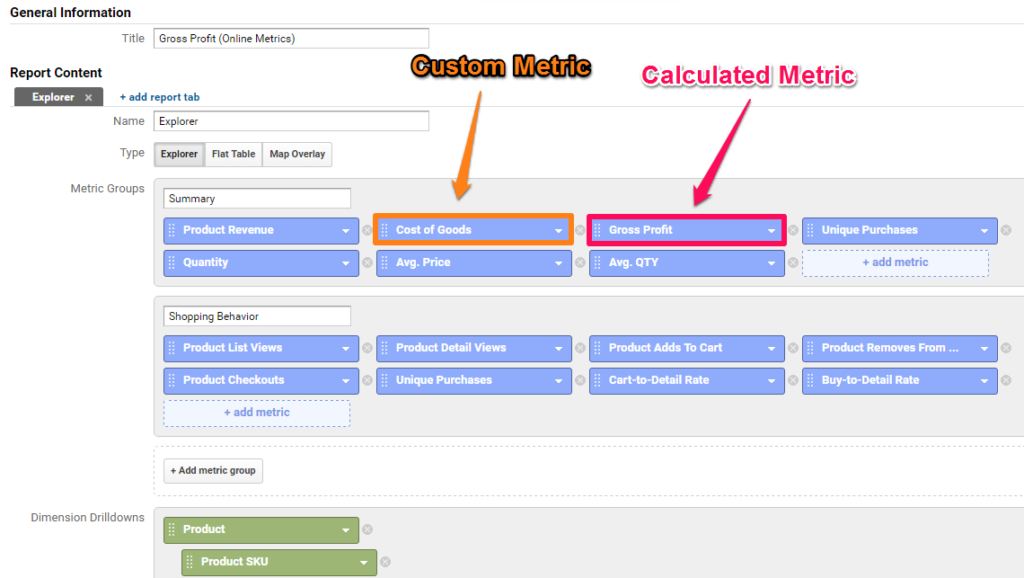 Feel free to adapt it to your needs!
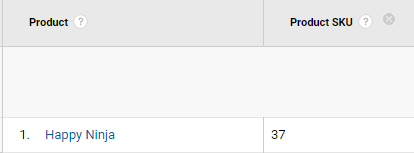
A snapshot of the main metrics in this report:
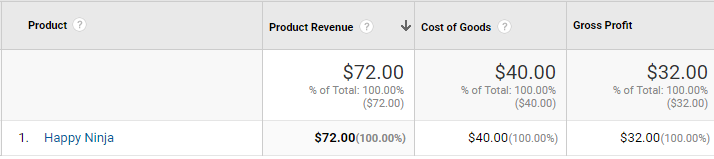
And as you might expect, ga:productName matches with ga:productSku from the earlier defined data import.
Optimize Ecommerce Performance
Of course, the goal of getting this data into Google Analytics, is not just reporting.
You want to analyze it and optimize your ecommerce performance accordingly.
A few examples of questions to answer:
- What’s the effect on Gross Profit in heavy promotion periods?
- Which product delivers the highest Gross Profit?
- Which products are actually costing us money?
- What is my overall gross profit margin?
- What is my gross profit margin per category?
- How can we increase our gross profit margin?
- Which channels drive the highest gross profit margin?
- What would be the effect on overall gross profit margin if we make our assortment smaller?
Note: configure an additional Calculated Metric to calculate the gross profit margin percentage (!)
Subtract the costs of goods sold from the total revenue. For example, if the company has $300,000 in revenue and $240,000 in costs of goods sold, you would subtract $240,000 from $300,000 to get $60,000. Divide the result from Step 2 by the revenue to calculate the gross margin.
Well, this is it from my side. Hope you enjoyed reading the post!
Do you have any additional thoughts? Make sure to share it with your audience if you think it is valuable for them as well.
One last thing... Make sure to get my extensive checklist for your Google Analytics setup. It contains 50+ crucial things to take into account when setting up Google Analytics.Download My Google Analytics Setup Cheat Sheet
The post Leverage Gross Profit Data to Enhance Your Google Analytics Insights appeared first on Online Metrics.