The phrase “Google Analytics API” might sound daunting. However, even without strong technical skills you can leverage the API for your business. And I am going to show how!
API refers to Application Program Interface and it is simply a set of instructions that you give to a program to get the information or data that you want.
You can either use the Google Analytics API to bring in data into Google Analytics or get data out of Google Analytics. As simple as that!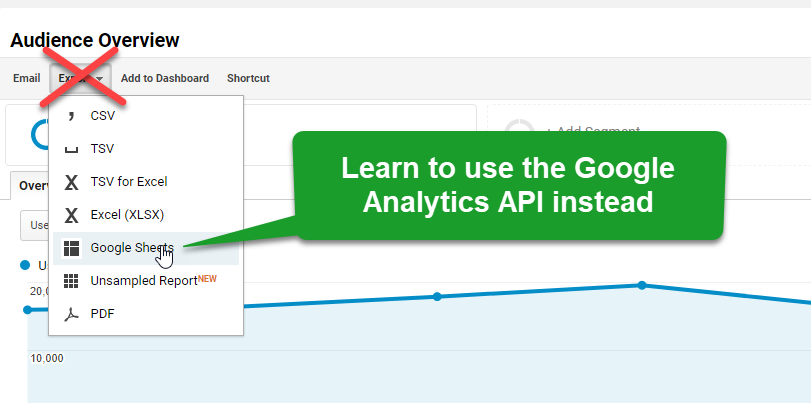 In this post, I will show you how to access and leverage the API without writing any code at all! The focus is on getting data out of Google Analytics.
My promise to you is that you can get started right away after reading this post (or even while reading).
Table of Contents
- Core Reporting API
- Most Important API Concepts
- Account Explorer
- Query Explorer
- Da Vinci Tools
- Supermetrics Add-On
- Advanced Use Cases
Core Reporting API
The Core Reporting API is by far the most common Google Analytics API. It’s widely used and you may have already been using it without knowing!
Knowing about the Core Reporting API is fundamental and can help you to:
- Query data from dozens of analytics properties/websites at once.
- Merge Google Analytics data with other data sources.
- Set up automated dashboards and custom reports.
- Schedule Google Analytics exports to other tools like Excel.
- Avoid/reduce data sampling through query partitioning.
Most Important Concepts
From a technical perspective there are a ton of concepts that are related to the Google Analytics API. As promised, wherever possible I will address everything from a non-technical standpoint.
The following subchapters explain about the most important options that you have when building your queries. Going through these will be a huge help in understanding the options behind the Google Analytics API and related reporting.
1. View IDs (Required)
Selecting the appropriate view ID is one of the first things you need to do when you start working with the Google Analytics API.
You can locate the view ID in the Google Analytics URL behind the “p”.
An example is shown below:
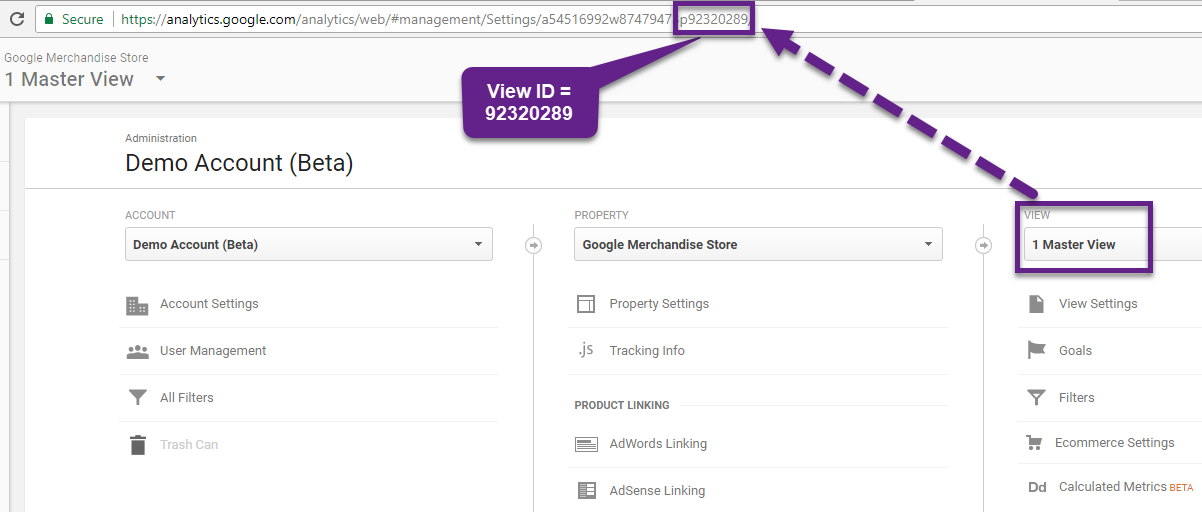 The unique ID is used to retrieve the Analytics data from the right Google Analytics view. This ID is the concatenation of the namespace ga: with the Analytics view (profile) ID. In this example it would be ga:92320289.
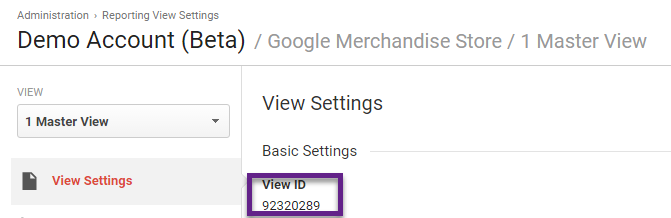
Another option is to go to the view settings. It’s easy to copy it from there!
2. Date Ranges (Required)
All Analytics data requests must specify a date range. If you do not include start-date and end-date parameters in the request, the server returns an error.
You have the option to set a start-date and end-date.
Date values can be for a specific date by using the pattern YYYY-MM-DD or relative by using today, yesterday, or the NdaysAgo pattern. Values must match the regular expression [0-9]{4}-[0-9]{2}-[0-9]{2}|today|yesterday|[0-9]+(daysAgo).
Feel free to check out my other post on Regular Expressions in Google Analytics if this sounds unfamiliar to you.
Start-date
Here are two examples of a start-date query:
- start-date=2017-08-31 // fixed
- start-date=14daysAgo // relative
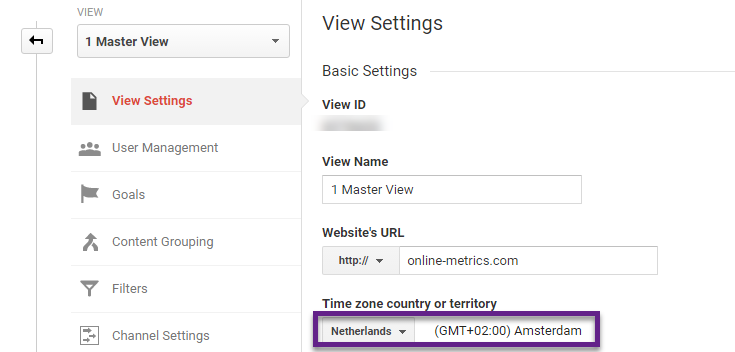
Keep in mind that relative dates are always relative to the current date at the time of the query and are based on the timezone of the view (profile) specified in the query.
3. Dimensions (Optional)
You could run a query without specifying any dimension. Doing this would result in an aggregated number.
As you know me a bit, you understand I won’t run that many aggregated queries. The insights are hidden in segments. :-)
The dimensions parameter breaks down metrics by common criteria; for example, by ga:userType or ga:browser.
There are some limitations and constraints:
- There is a maximum of 7 dimensions per query.
- In addition to your dimension, your query must include at least one metric.
- Not all metrics and dimensions can be combined. This is a great resource on metrics and dimensions if you want to learn more.
A query that includes two dimensions would look like this:
dimensions=ga:userType,ga:browser
Make sure to get the capital characters right!
I recommend to check out a few other articles to learn all about metrics and dimensions – the building blocks of any query or API report.
- 10 Tips to Master Metrics and Dimensions in Google Analytics.
- 7 Unique Ways to Leverage Google Analytics Dimensions.
- 5 Common Web Analytics Metrics Demystified.
4. Metrics (Required)
The working of metrics is quite similar to dimensions.
Here is a quick example:
metrics=ga:sessions,ga:users
The Metrics and Dimensions reference is a great help especially if you are just starting out with the Google Analytics API queries.
For metrics there are some limitations and constraints as well:
- Any reporting API request must contain at least one metric.
- There is a maximum of 10 metrics per query.
- Most combinations of metrics from multiple categories can be used together, provided no dimensions are specified.
- A metric can be used in combination with other dimensions or metrics, but only where valid combinations apply for that metric. See the Dimensions and Metrics Reference as stated before.
5. Sorting (Optional)
Here is an example of how this query might look like:
sort=ga:country,ga:deviceCategory
Two simple rules apply here:
- Sorting order is specified by the left to right order of the metrics and dimensions listed.
- Sorting direction defaults to ascending. This can be changed to descending by using a minus sign (-) prefix on the requested field. For example: sort=-ga:country.
This can be very useful. For example, you want to build a dashboard in Google Sheets or Google Data Studio. And your first step is to get the data into Google Sheets. In this case it might be handy to get the data in a particular order on a sheet to more easily build your dashboard.
Keep these rules in mind when using the sort function:
- Sort only by dimensions or metrics values that you have specified in your query.
- By default, strings are sorted in ascending alphabetical order in en-US locale.
- Numbers are sorted in ascending numeric order by default.
- Dates are sorted in ascending order by date by default.
6. Sampling Level (Optional)
Sampling in Google Analytics can be a pain, especially if you are a fan of segmentation – like me – and have a ton of data coming in every month.
It’s possible to minimize the effects of sampling by specifying the sampling level.
The default setting looks like:
samplingLevel=DEFAULT
You have three options here:
- DEFAULT – Returns response with a sample size that balances speed and accuracy.
- FASTER – Returns a fast response with a smaller sample size.
- HIGHER_PRECISION – Returns a more accurate response using a large sample size, but this may result in the response being slower.
Data accuracy is more important than speed in most cases (imo)!
Two more things:
- Read this article to learn more about how to handle large data requests.
- Later on I will introduce a tool that can help to deal with sampling in a very effective way.
7. Segments (Optional)
Segments but also filters (which I will explain about in a minute) are very complicated in the Google Analytics API.
- Here is a great reference if you want to learn all about segments and the Google Analytics API. // technical perspective
- This is a great API reference on segments, useful from a marketing perspective.
For now I simply want you to know that you can use segmentation when running your Google Analytics API queries. Later on you will get my best tips on how to approach this from a non-technical perspective.
8. Filters (Optional)
The last concept I want to describe are filters.
Here is how it works:
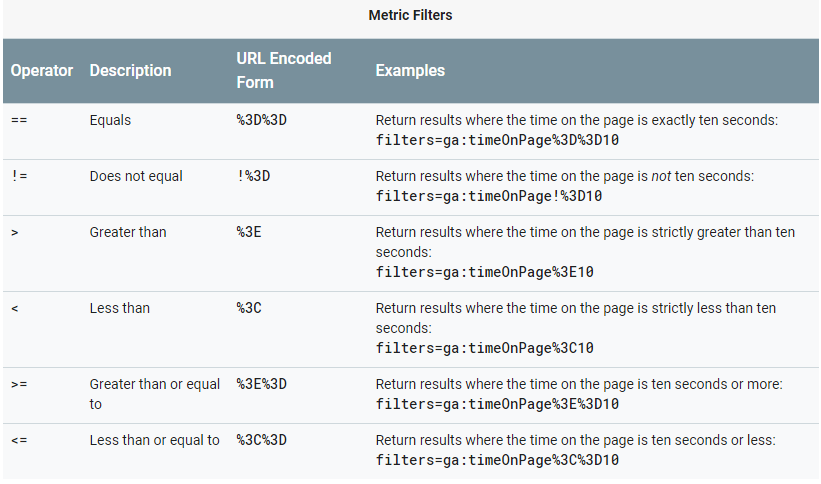
“The filters query string parameter restricts the data returned from your request. To use the filters parameter, supply a dimension or metric on which to filter, followed by the filter expression. Filtered queries restrict the rows that do (or do not) get included in the result. Each row in the result is tested against the filter: if the filter matches, the row is retained and if it doesn’t match, the row is dropped.”
You can apply both metric and dimension filters.
Please review the tables below.
Metric Filters![Metric Filters]() Dimension Filters
Dimension Filters
 Dimension Filters
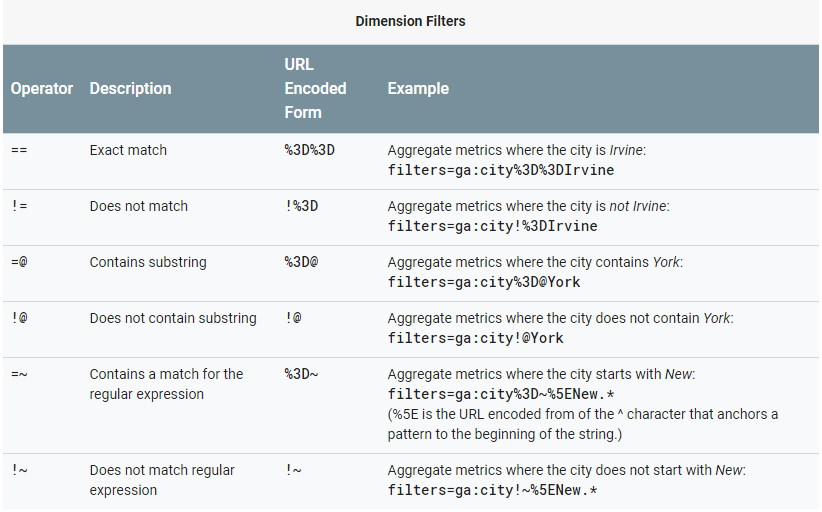 I understand if this looks daunting to you. For now, just keep in mind that it is possible to work with filters and segments when using the Google Analytics API.
Happily there are easier ways to get this data than writing out all those queries. It’s just that you have a more solid background while going through these examples and how everything works.
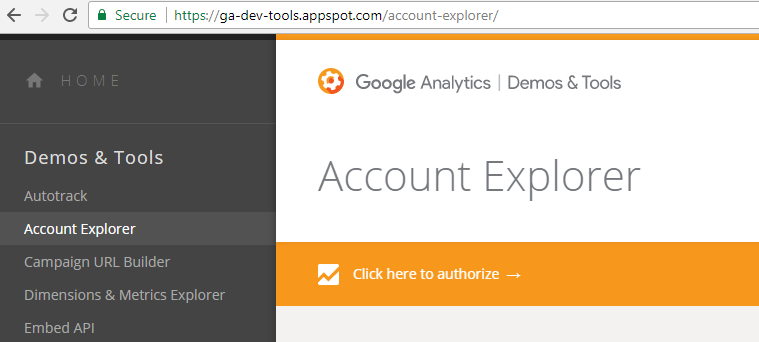
Account Explorer
The Account Explorer is a perfect tool to explore your Google Analytics account(s) and find all basic property and view information.
Step 1: Navigate to the Account Explorer.
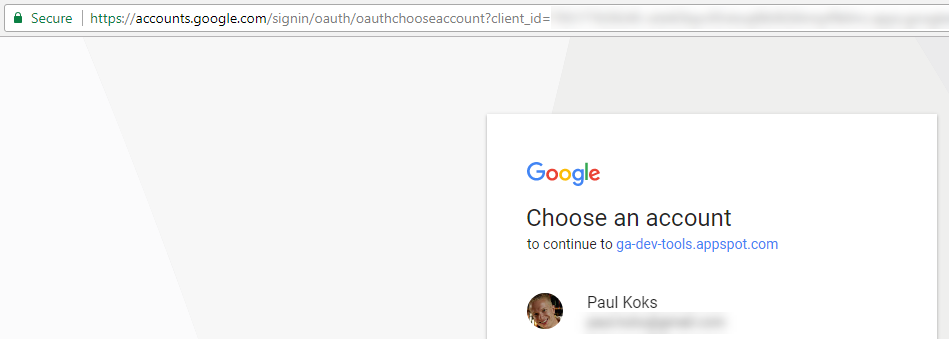
Step 2: Authorize Account Explorer to access your Google Analytics account(s).
Step 3: Retrieve any account, property or view ID.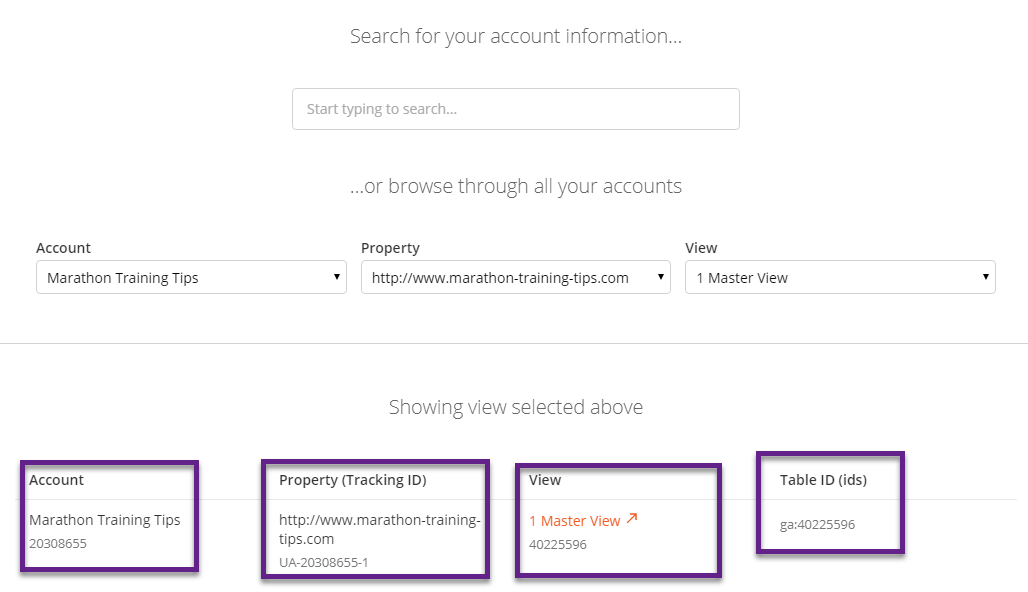
You can now see the various IDs related to your Google Analytics account.
- Account ID
- Property ID
- View ID
- Table ID
Query Explorer
Now it gets more exciting and you can use what you have learned earlier in this blogpost!
You need to build and execute queries in order to access GA data via the Core Reporting API. Query Explorer can help you with that.
Step 1: Navigate to the Query Explorer page.
Step 2: Authorize Query Explorer to access your Google Analytics account(s).
Step 3: Select the Analytics View where you want to run your query on.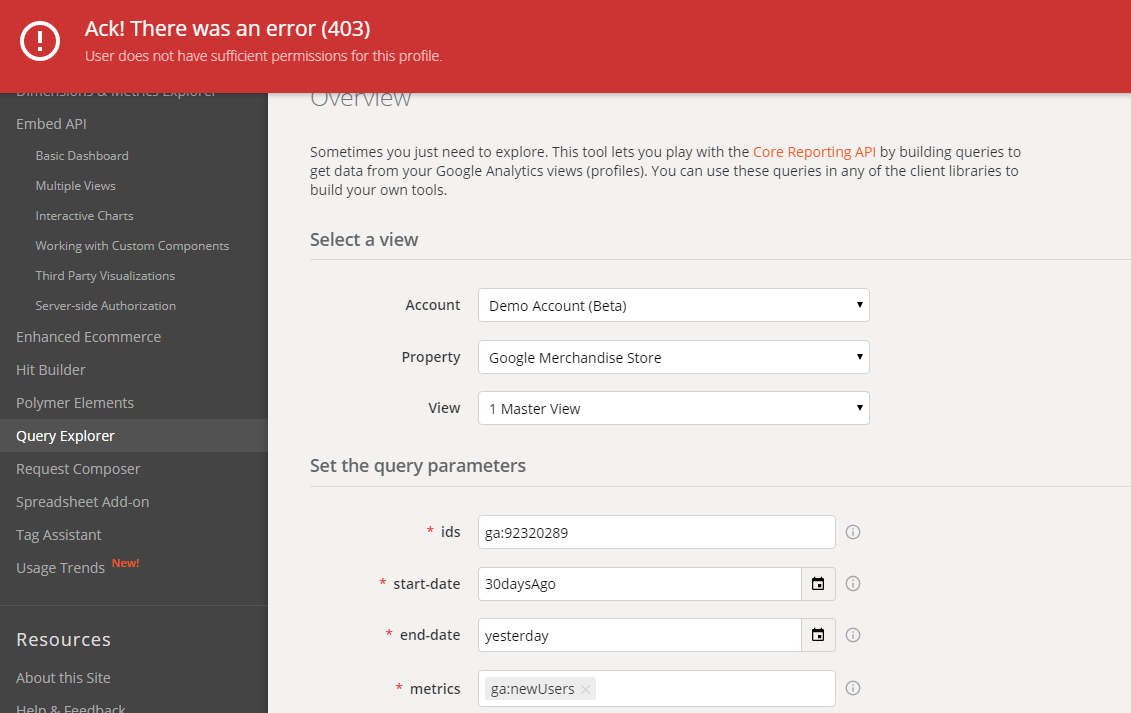
I wanted to show you this example as I have Read & Analyze access to this view in the Google Analytics Demo Account.
To run a query via the Google Analytics Core Reporting API, you need Collaborate access at a minimum.
Here is an example:
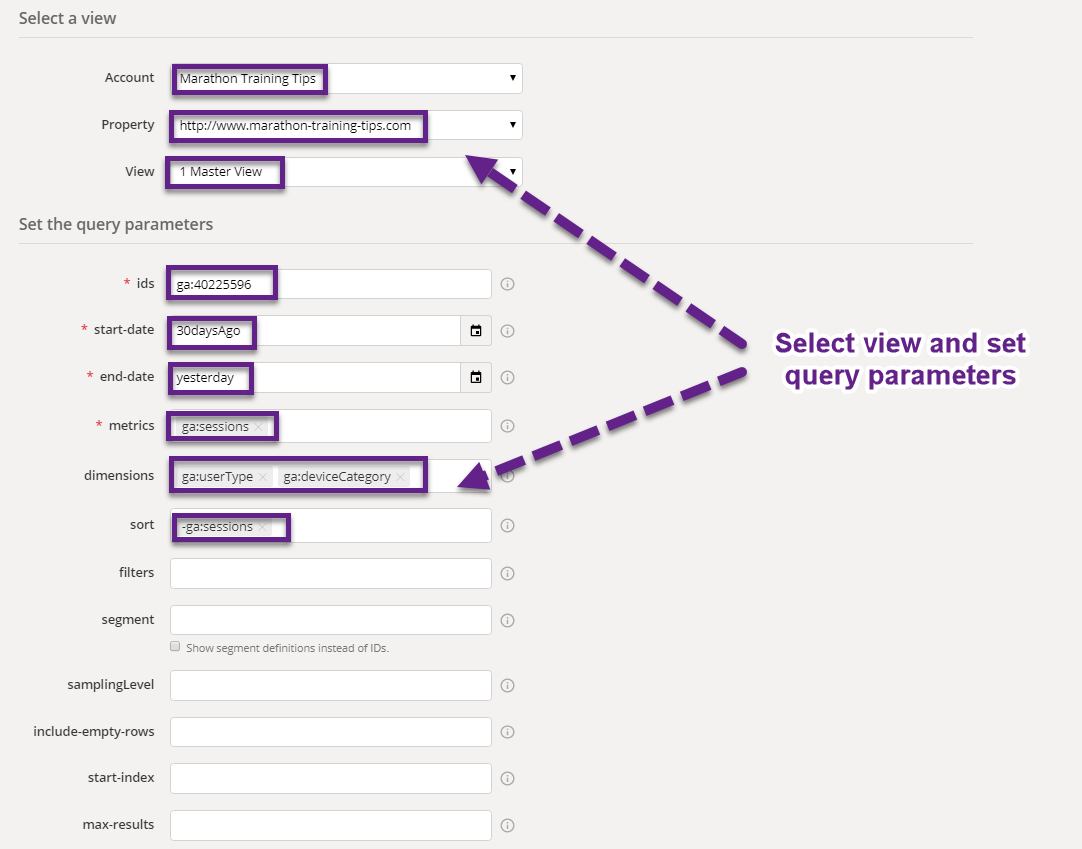 For these fields you can type in a few characters related to your query and Google Analytics returns possible options. It’s very handy to get started.
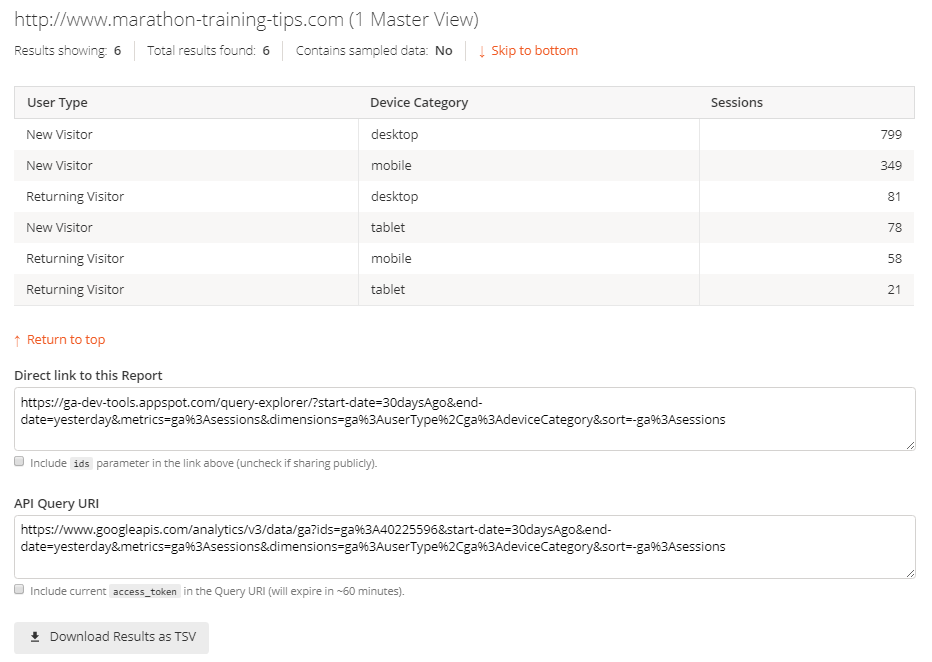
And here are the results after you run a query:
 Here is what I recommend:
- Review the table if you are a marketer or analyst not caring about the technical details.
- Review the direct link and API Query URI if the technical details are important for you.
Start with simple queries and expand with trying out filters and segments to get a better idea of how the Core Reporting API actually works.
Da Vinci Tools
Stéphane Hamel has built another great tool your can leverage here as well!
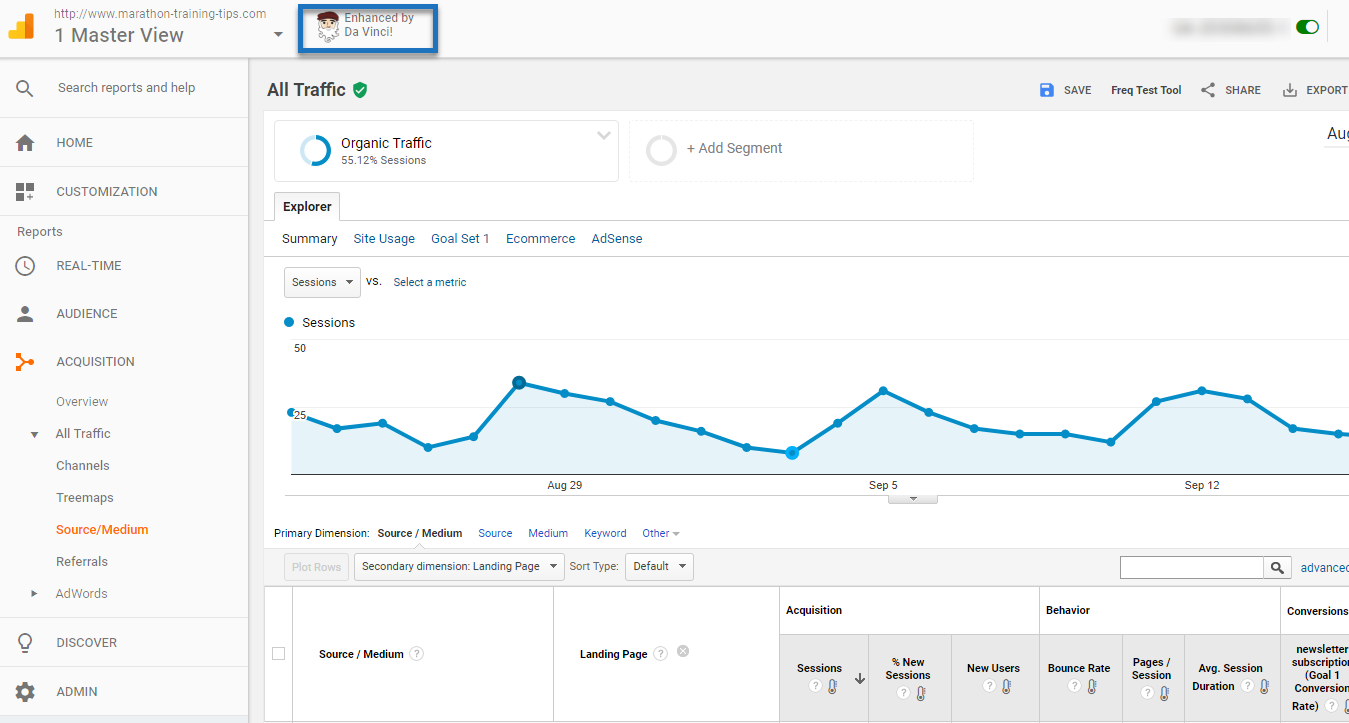
It’s called Da Vinci Tools and it comes with a lot of great features to enhance your Google Analytics and GTM experience.
The new Export option – Reporting API – looks at the current GA report and grabs as much info as possible to build the API request. It’s a great start to learn more about how the API functions.
Step 1: download Da Vinci Tools in the Chrome Store.
Step 2: open a Google Analytics report.
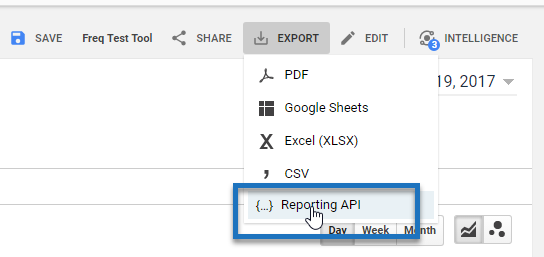
Step 3: click on Export >> Reporting API.
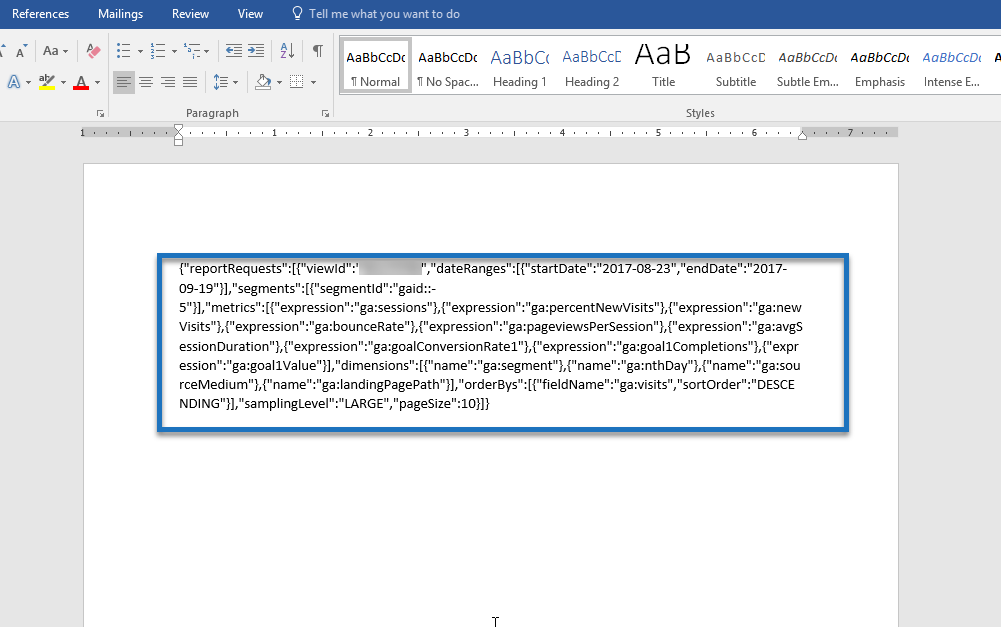
Magically all information is copied to clipboard.
Step 4: paste it in your application of choice.
And there you have it! You will see it takes less than a minute to learn the basics.
Note: you can use this functionally on Google Analytics views where you only have “read & analyze” access. Keep in mind that you need “collaborate” access to actually get the data out of Google Analytics.
Supermetrics Add-On
I have great news for you. There are several add-ons available for Google Chrome and one of them is really powerful: Supermetrics for Google Sheets.
You can run complex queries and build them without having any technical/code knowledge.
However, I wanted you to get familiar with the API so that you know something about the background of this tool.
Getting up-to-speed with Supermetrics is very easy.
Step 1: download Supermetrics in the Chrome Store (trial for 30 days with all features included).
Step 2: open a blank Google Sheet and go to the Supermetrics add-on.
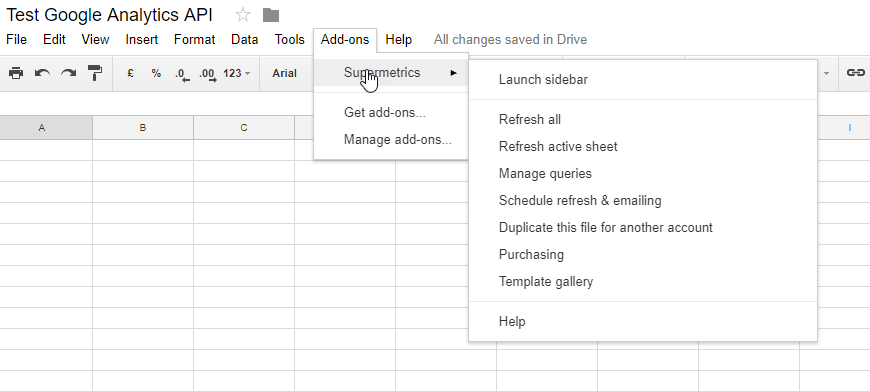
Step 3: run your Supermetrics query.
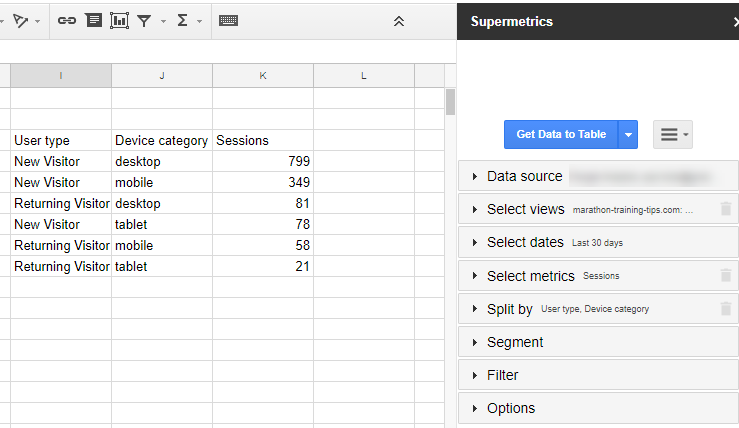
Does it look familiar to you? It should be as it is the same query that I ran earlier via the Query Explorer. :-)
Why this add-on is very poweful:
- It allows you to easily add filters and segments without technical knowledge.
- It offers an option to avoid sampling – while automatically breaking up your query if needed to. It’s hidden under “Options”: Try to avoid Google’s data sampling (can slow down data fetching).
- It allows you to connect to multiple data sources, e.g. Google Analytics, Google AdWords, Moz, Bing Ads.
- It allows you to automatically schedule refreshes and email reports.
- It allows to directly connect multiple data sources to Google Data Studio.
Well, check it out for yourself and let me know if you need any help!
Advanced Use Cases
We’ve covered a lot today. I will finish with two Google Analytics API use cases.
Google Sheets Dashboard
Ben Collins is one of the masters in Google Sheets. I highly recommend to check out his site to learn more.
After finishing one of his courses I build a dashboard (by leveraging Google Sheets and the Core Reporting API). These are some of the widgets in the dashboard: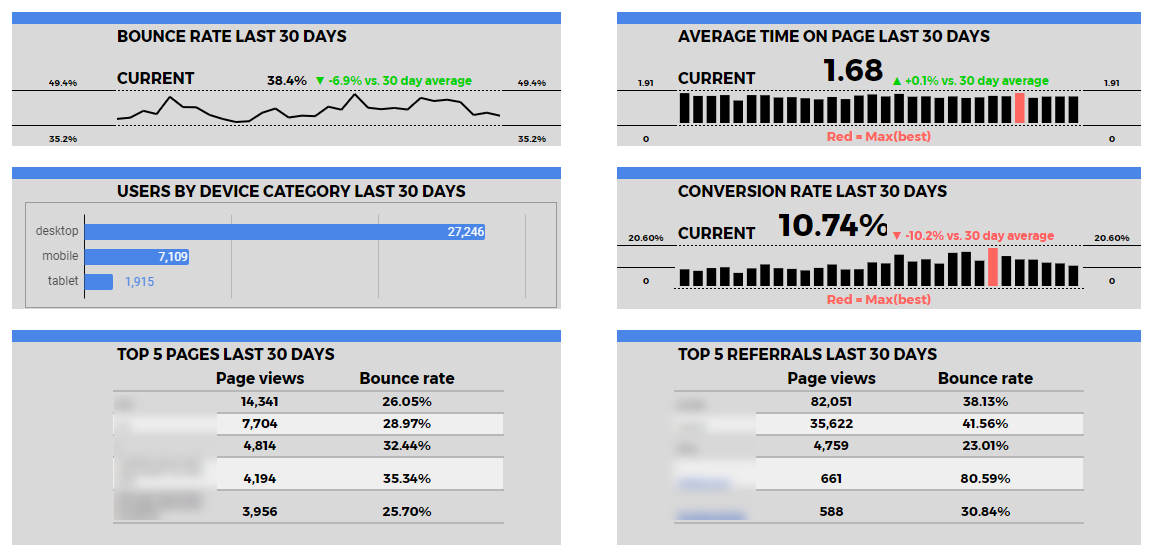 Everything is automatically refreshed and I can easily share it with clients.
Google Analytics Audit Tool
As a Google Analytics Audit specialist, I decided to build an automated GA audit tool that takes away some of the hard work.
I set up over 50 advanced queries and calculations to automatically extract data via the Google Analytics Core Reporting API.
And this is a sneak peek on how it looks like:
 Are you ready to start leveraging the Reporting API of Google Analytics?
Well, this is it for today! How do you currently use the API and what are your future plans? Happy to hear your comments!
One last thing... Make sure to get my extensive checklist for your Google Analytics setup. It contains 50+ crucial things to take into account when setting up Google Analytics.Download My Google Analytics Setup Cheat Sheet
The post Google Analytics API: The Non-Technical Guide appeared first on Online Metrics.