Most probably you are familiar with running AdWords campaigns, but do you use all AdWords reports in Analytics to really get the most out of it? This blogpost will help you leverage the AdWords integration to its fullest extent.
The Google AdWords reporting environment is great, but does it really go beyond measuring success and failure?
For marketers, website owners and analysts like you, it’s critically important to analyze your visitors and their behavior in much more depth.
And this is exactly what the AdWords integration with Google Analytics can offer.
In the rest of this post I will cover a ton of things. Feel free to skip the first few chapters if you are an experienced AdWords analyst and optimizer!
Table of Contents
- How to Integrate AdWords and Google Analytics
- AdWords Dimensions and Metrics
- AdWords Standard Reports
- Advanced AdWords Optimization
- Concluding Thoughts
Nothing more to add, let’s dive right in!
How to Integrate AdWords and Analytics
In this chapter you will learn how to effectively integrate AdWords and Google Analytics. It’s a five-step process you can easily follow along while reading.
Step 1: set up the necessary access levels.
- You need to have edit access to the Google Analytics property you want to link to.
- You need to have administrative access to the Google AdWords account you want to link from.
Step 2: link AdWords to one or more Google Analytics views.
You can get this done via the admin section in Google Analytics.
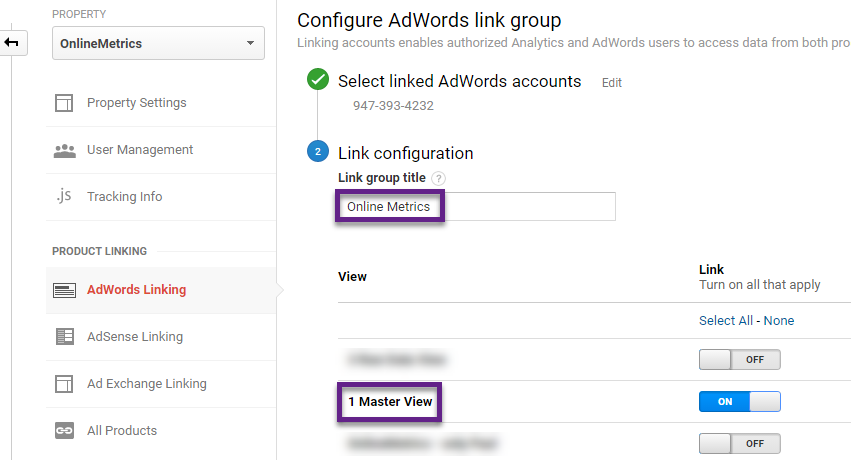
1. Go to AdWords Linking and select your AdWords account.
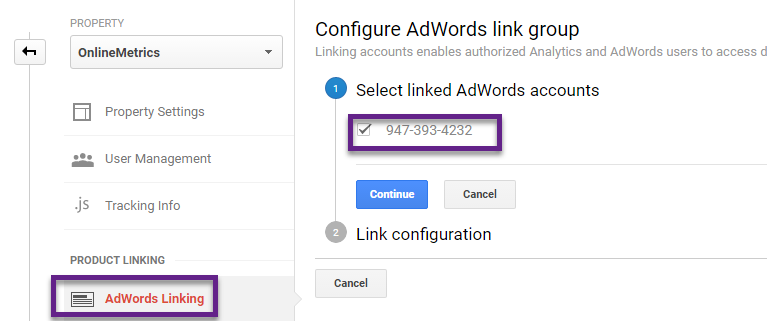
2. Modify the link configuration to your needs.
Make sure to take note of this before you set up this link: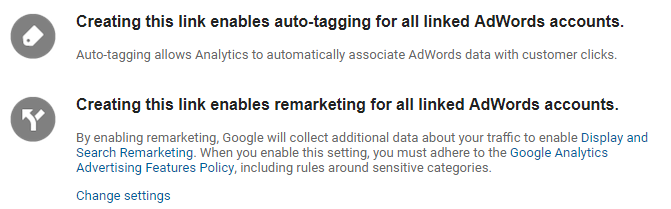
One quick thing, if desired you can edit this configuration in AdWords as well:
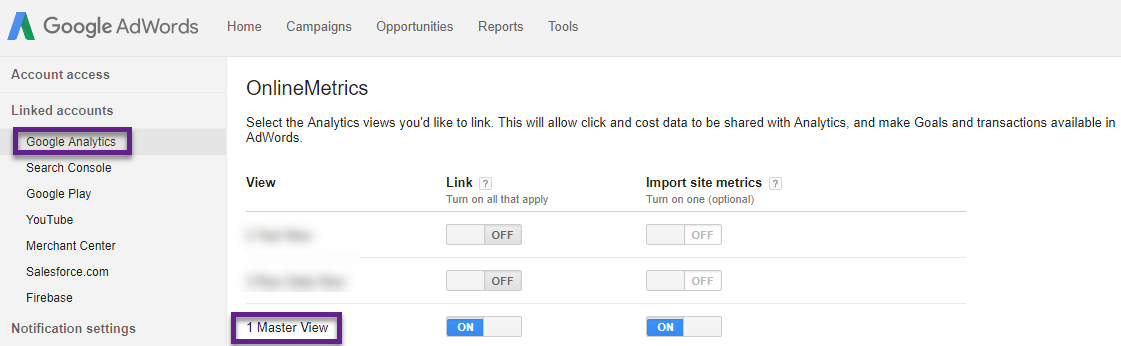
As you can see, linking happens at the property level. It’s up to you to choose in what Google Analytics view(s) to import the AdWords data.
This can be very helpful as sometimes you want to hide AdWords data. E.g. when you have external agencies accessing your GA data and you don’t want to reveal AdWords numbers to them.
Step 3: choose the auto-tagging settings.
You can find and edit these settings in Google Analytics, below the link configuration.
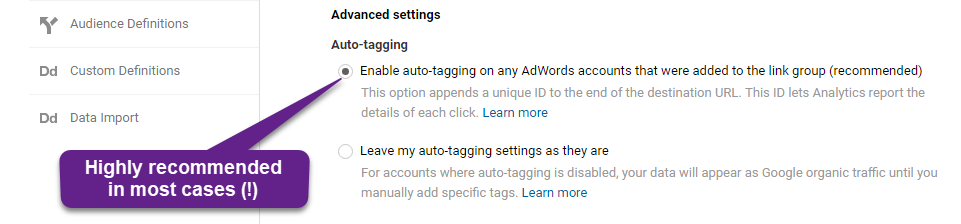 In more than a few Google Analytics audits I came across integration issues. And many times this was more or less related to getting this auto-tagging thing wrong.
Auto-tagging gives you a much richer data set (not limited to five dimensions) and will save you a lot of trouble. But, there are special cases when you want to do the tagging yourself. It’s up to you, but be warned!
Step 4: split between brand and generic paid search.
On the traffic source level, I love to use the channel reporting in addition to the source/medium reports.
One way to get a more detailed view is by splitting up your brand and generic terms. You can set this up at the view level (again in the admin section).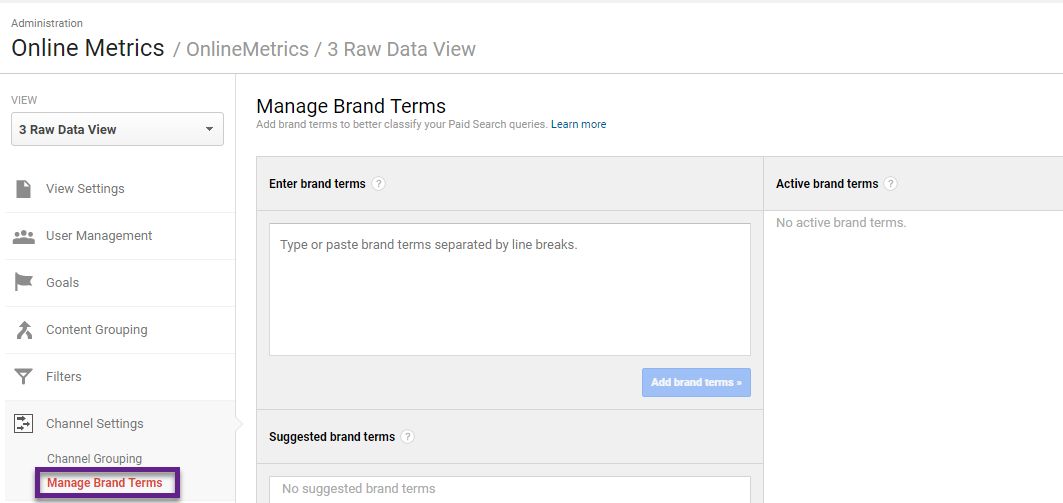
Here is a quick report example:
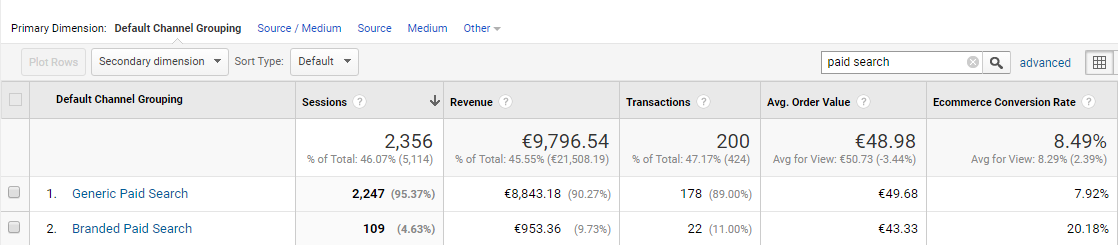
It allows you to quickly evaluate the share of both groups, both in terms of traffic as well as (last cookie) conversions.
Step 5: create segmented views.
I have written a ton before about segmentation and filters. Two articles to check out:
- Ultimate Guide to Google Analytics Filters.
- Top 10 Things to Know About Google Analytics View Filters.
You can set up different, segmented views based on a wide range of segmentation rules.
There are two filters involved if you want to set up a view that only captures AdWords traffic.
AdWords is recognized as:
- Medium = cpc
- Source = google
And here are the filters: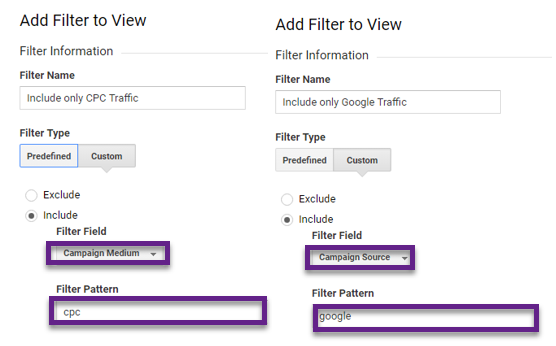 One last thing, you need to use a Regular Expression if you want to capture both Bing and Google cpc traffic.
The campaign source filter would look like this: google|bing.
This is because you can’t use more than one include filter of the same type. Doing so will result in capturing no traffic at all.
AdWords Dimensions and Metrics
The concepts of metrics and dimensions are crucial to understand before you dive into the AdWords reports in Google Analytics.
In this chapter I will provide you with a quick overview of both so that you can better analyze your AdWords data.
Before describing each of them, let’s take a look at the screenshot below: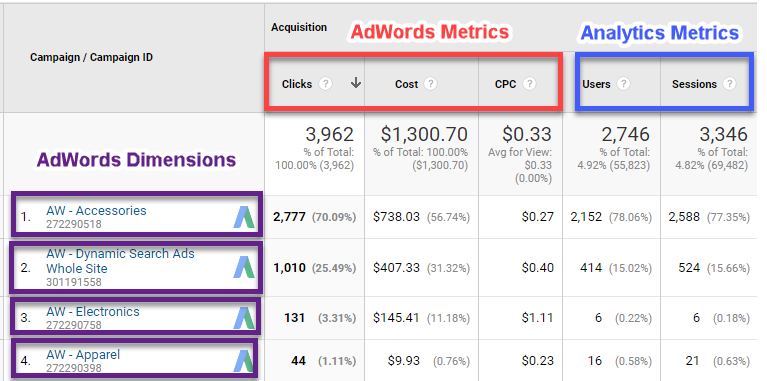 In this example:
- AdWords Dimension: Campaign. Dimensions make up the rows in Google Analytics reports.
- AdWords Metrics: Clicks, Cost and CPC. Metrics make up the columns in Google Analytics reports.
- Analytics Metrics: Users and Sessions. Learn more about the differences between AdWords Clicks and Analytics Sessions.
AdWords Dimensions
Here is an overview of all AdWords Dimensions including their corresponding API names. Once you start with automating some of your reporting tasks, you will be glad to know more about the API references.
| Dimension Name | API Name | Explanation |
|---|---|---|
| Ad Distribution Network | ga:adDistributionNetwork | The network (Content, Search, Search partners, etc.) used to deliver the ads. |
| Ad Format | ga:adFormat | The AdWords ad format (Text, Image, Flash, Video, etc.). |
| Ad Group | ga:adGroup | The name of the AdWords ad group. |
| Ad Slot | ga:adSlot | The location (Top, RHS, or not set) of the advertisement on the hosting page. |
| AdWords Ad Group ID | ga:adwordsAdGroupID | AdWords Ad Group ID. |
| AdWords Campaign ID | ga:adwordsCampaignID | AdWords Campaign ID. |
| AdWords Creative ID | ga:adwordsCreativeID | AdWords Creative ID. |
| AdWords Criteria ID | ga:adwordsCriteriaID | AdWords Criteria ID. |
| AdWords Customer ID | ga:adwordsCustomerID | Customer's AdWords ID. |
| Destination URL | ga:adDestinationUrl | The URL to which the AdWords ads referred traffic. |
| Display URL | ga:adDisplayUrl | The URL the AdWords ads displayed. |
| Keyword Match Type | ga:adKeywordMatchType | The match type (Phrase, Exact, or Broad) applied to the keywords. |
| Placement Domain | ga:adPlacementDomain | The domain where the ads on the content network were placed. |
| Placement Type | ga:adTargetingOption | It is Automatic placements or Managed placements, indicating how the ads were managed on the content network. |
| Placement URL | ga:adPlacementUrl | The URL where the ads were placed on the content network. |
| Query Match Type | ga:adMatchType | The match type (Phrase, Exact, Broad, etc.) applied for users' search term. Ads on the content network are identified as "Content network". |
| Query Word Count | ga:adQueryWordCount | The number of words in the search query. |
| Search Query | ga:adMatchedQuery | The search query that triggered impressions. |
| Targeting Type | ga:adTargetingType | This (keyword, placement, or vertical targeting) indicates how the AdWords ads were targeted. |
| TrueView Video Ad | ga:isTrueViewVideoAd | A boolean, Yes or No, indicating whether the ad is an AdWords TrueView video ad. |
AdWords Metrics
| Metric Name | API Name | Description |
|---|---|---|
| Clicks | ga:adClicks | Total number of times users have clicked on an ad to reach the property. |
| Cost | ga:adCost | Derived cost for the advertising campaign. Its currency is the one you set in the AdWords account. |
| Cost per Conversion | ga:costPerConversion | The cost per conversion (including ecommerce and goal conversions) for the property. |
| Cost per Goal Conversion | ga:costPerGoalConversion | The cost per goal conversion for the property. |
| Cost per Transaction | ga:costPerTransaction | The cost per transaction for the property. |
| CPC | ga:CPC | Cost to advertiser per click. |
| CPM | ga:CPM | Cost per thousand impressions. |
| CTR | ga:CTR | Click-through-rate for the ad. This is equal to the number of clicks divided by the number of impressions for the ad. |
| Impressions | ga:impressions | Total number of campaign impressions. |
| ROAS | ga:ROAS | Return On Ad Spend (ROAS) is the total transaction revenue and goal value divided by derived advertising cost. |
| RPC | ga:RPC | RPC or revenue-per-click, the average revenue (from ecommerce sales and/or goal value) you received for each click on one of the search ads. |
There are eight calculated AdWords metrics. The exceptions are Clicks, Cost and Impressions. As you can see there are a ton of AdWords metrics and dimensions available which you can correlate with other data.
AdWords Reports
You probably know Google Analytics has a ton of standard reports and that you can set up custom reports as well.
The standard reports already carry a lot of insights and I will quickly go through each of them. The Google Analytics Demo Account is used for demonstration purposes.
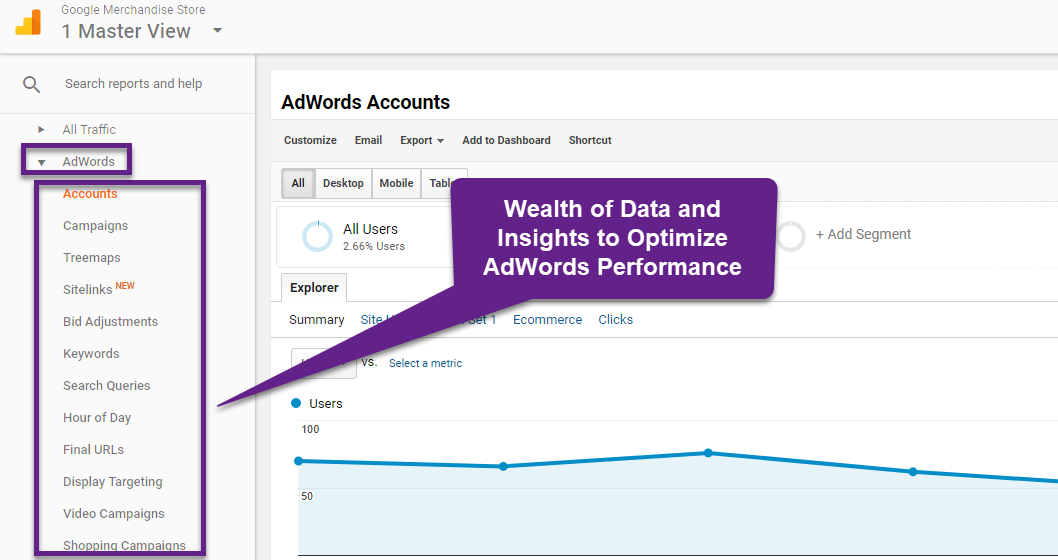
Navigate to Acquistion >> AdWords. And you will see something similar as to what is shown below:
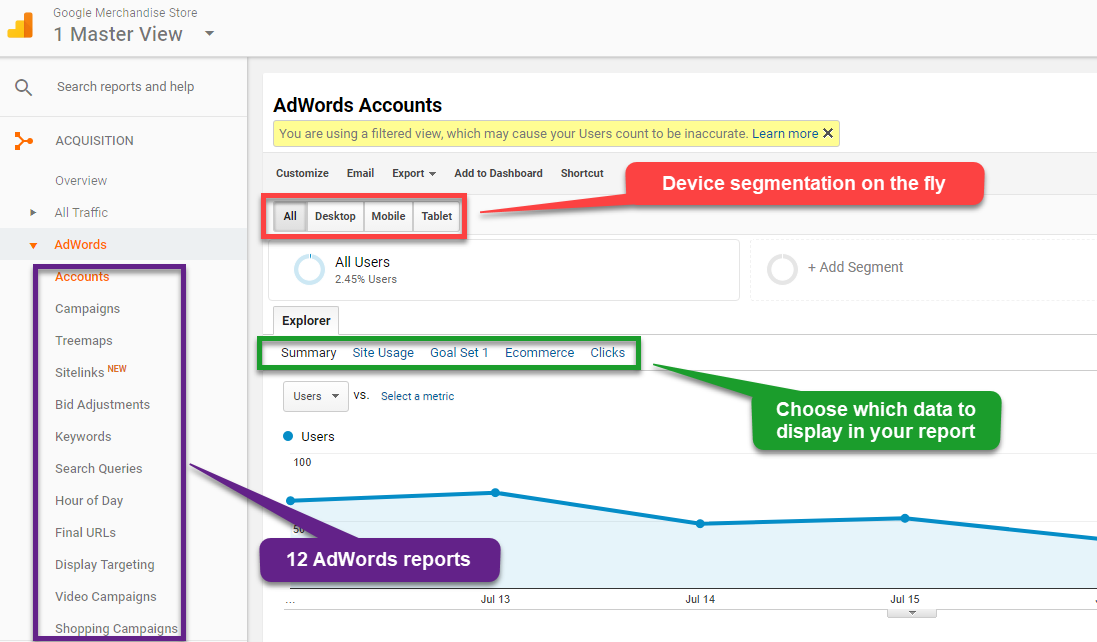 On the left side you can see there are 12 standard reports available.
- Purple: choose which report to display.
- Red: choose whether or not to segment your report on device category.
- Green: choose how and which data to display in your AdWords report.
1. Accounts Report
This report is only useful for large advertisers with multiple AdWords accounts connected to their Google Analytics account.
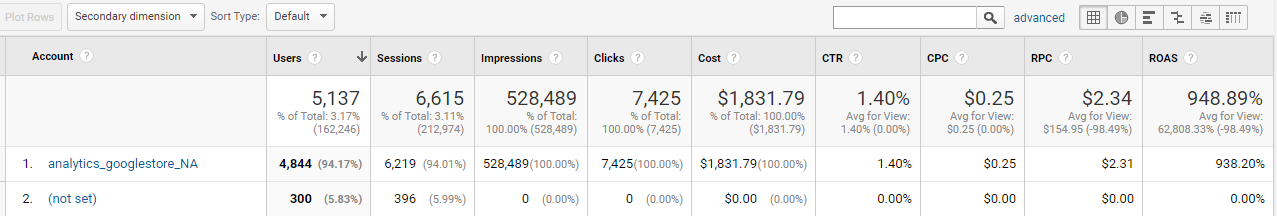 In this case there is only one AdWords account to evaluate. However, you could quickly evaluate metrics like ROAS among multiple AdWords accounts if you have more than one account connected to GA.
2. Campaigns Report
This report helps you to quickly identify which campaigns, ad groups and keywords are best and worst performing. So it will help you to take the right action (in AdWords).
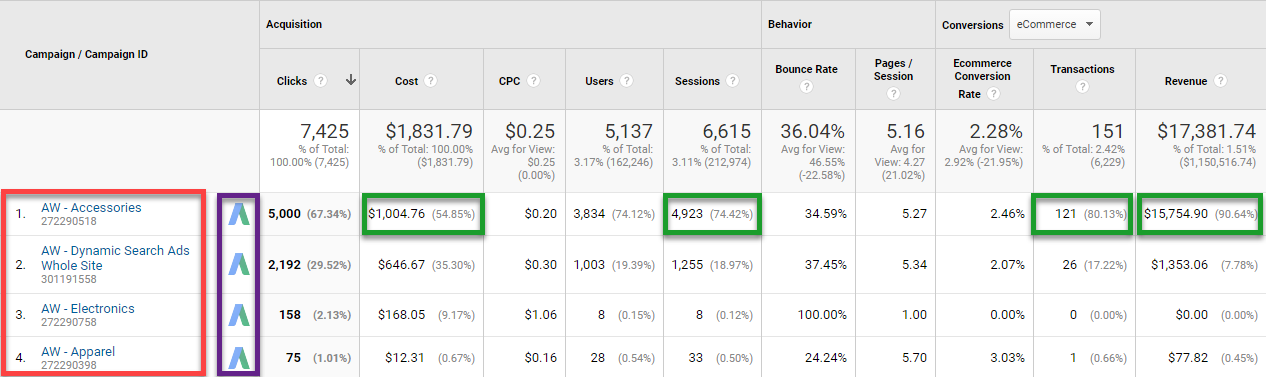
- Red: multiple campaigns are configured in this AdWords account.
- Purple: you can follow the links to go to AdWords.
- Green: the accessories campaign brings in the majority of traffic and has the highest cost. There are relatively more transactions and revenue coming from this campaign – it looks like this campaign is outperforming the other AdWords campaigns.
3. Treemaps Report
This report is for you if you prefer analyzing your data set and metrics via a data visualization.
On default state it is focused at the account level. Usually you want to drilldown to the campaign or even Ad Group level.
Here is an example of how the report looks like at the Ad Group level:
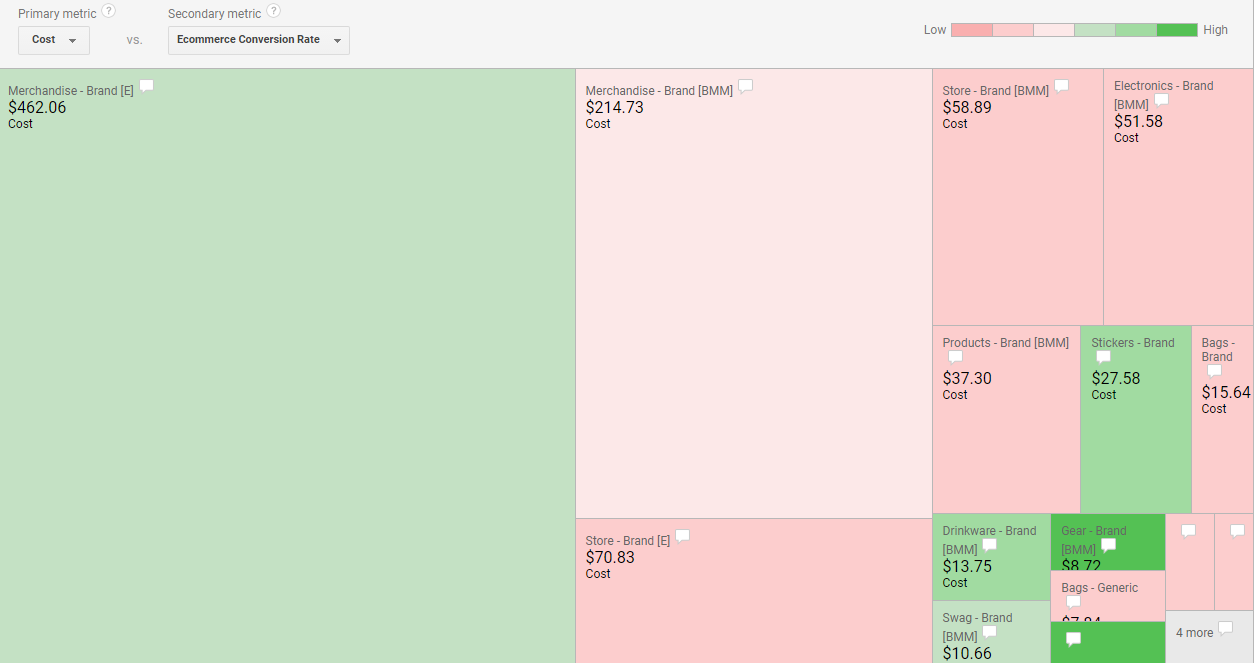
As you can see, the report looks a bit clumsy if you have too much Ad Groups for a certain campaign, but still it presents you with a very nice visual overview of your data.
- Primary metric (Cost): the Ad Group with highest Cost are displayed in the top left corner.
- Secondary metric (Ecom CR%): the darker the green, the better the performance on the secondary metric.
- Conclusion: there are quite a few Ad Groups with low Cost (and probably Reach) that perform well in terms of Ecom CR%. Would it be possible to attract more visitors to the site on related keywords to this Ad Group?
Read this post about Google Data Studio if you want to take data visualization to the next level.
4. Sitelinks Report
Sitelinks can take people to specific pages on your site – your store hours, a specific product, or more. When someone clicks or taps on your links, they skip right to what they want to know or buy. There is a specific report in Analytics where you can analyze this data.
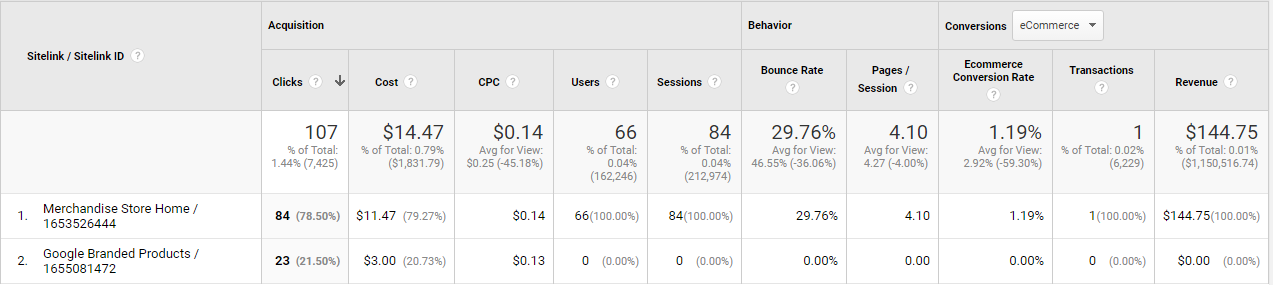
Read this article if you want to learn more about Sitelink Extensions.
5. Bid Adjustments Report
Bid adjustments allow you to show your ads more or less frequently based on where, when, and how people search. For example, sometimes a click is worth more to you if it comes from a smartphone, at a certain time of day, or from a specific location.
Here you can see more specific information regarding what is possible:
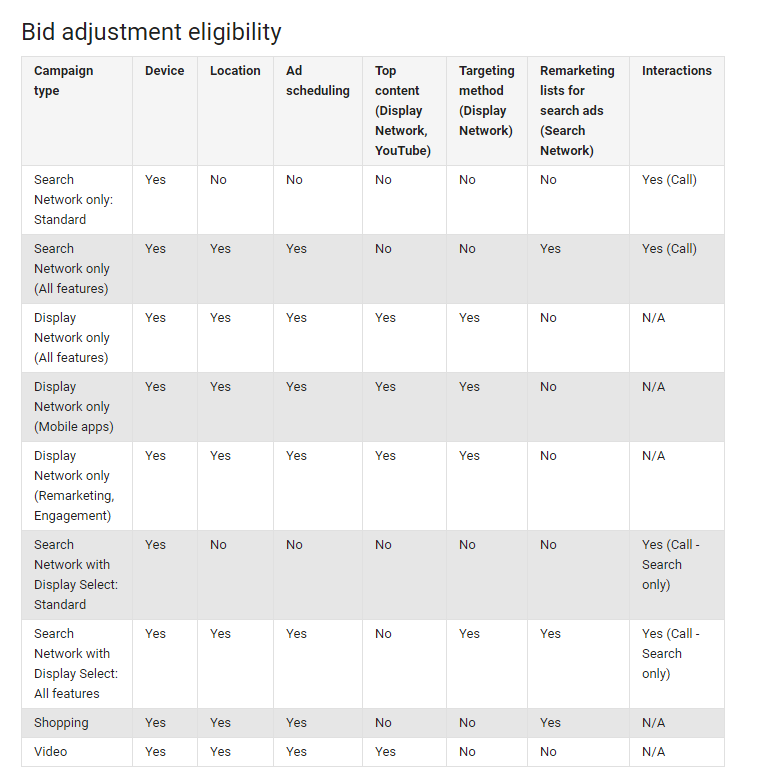 This information can be very beneficial as you can evaluate your bid adjustments on many different Analytics metrics and KPIs in addition to the standard AdWords ones.
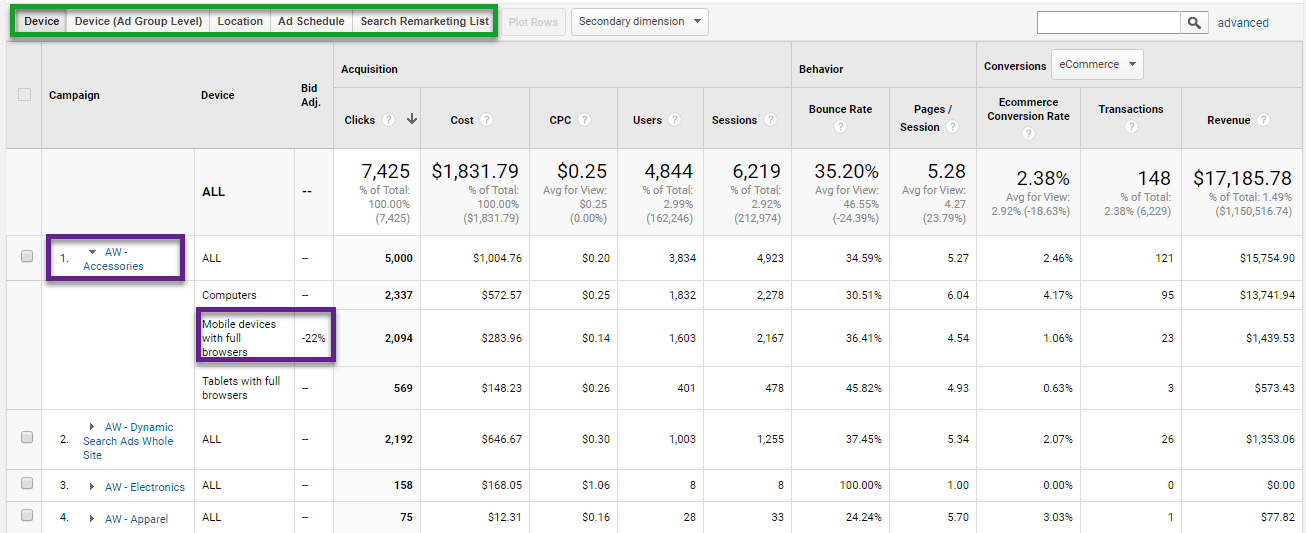
This allows you to quicker and better evaluate the performance of each of your campaigns.
6. Keywords Report
The main reason why I love this report, is that you can quickly evaluate keyword performance across all campaigns.
You can use secondary dimensions. advanced table filters and segments to further zoom in at a specific keyword set.
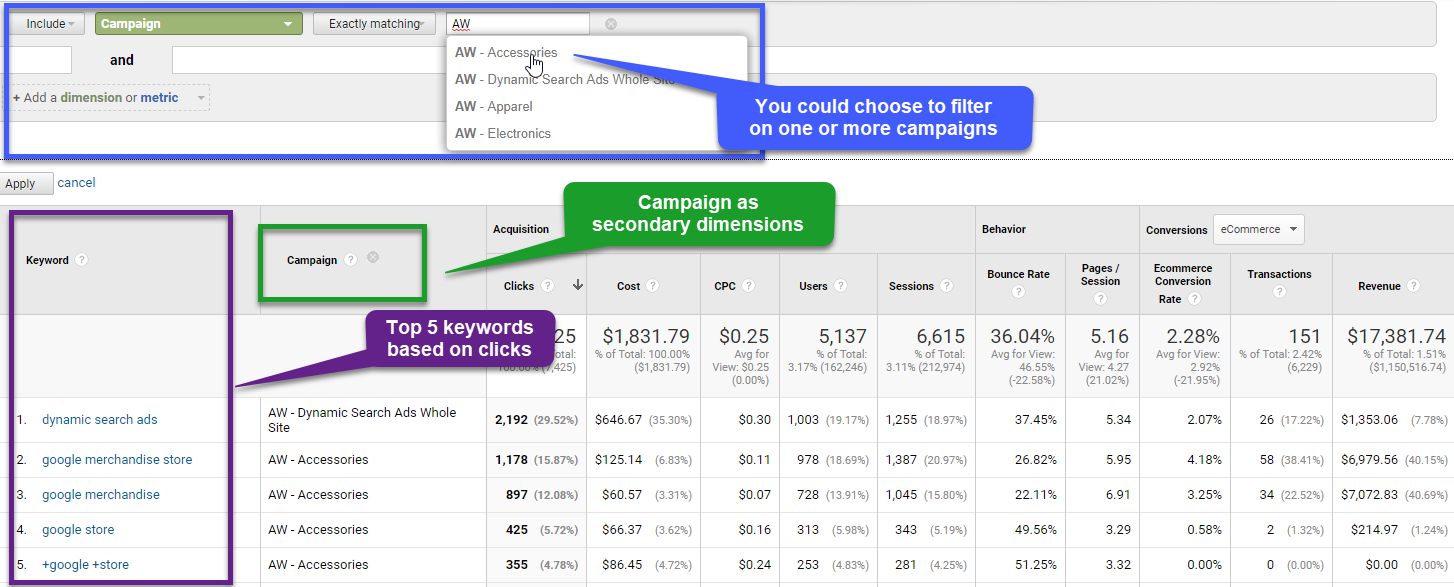
There are a ton of opportunities here in reviewing and optimizing the performance of each of your keywords and campaigns.
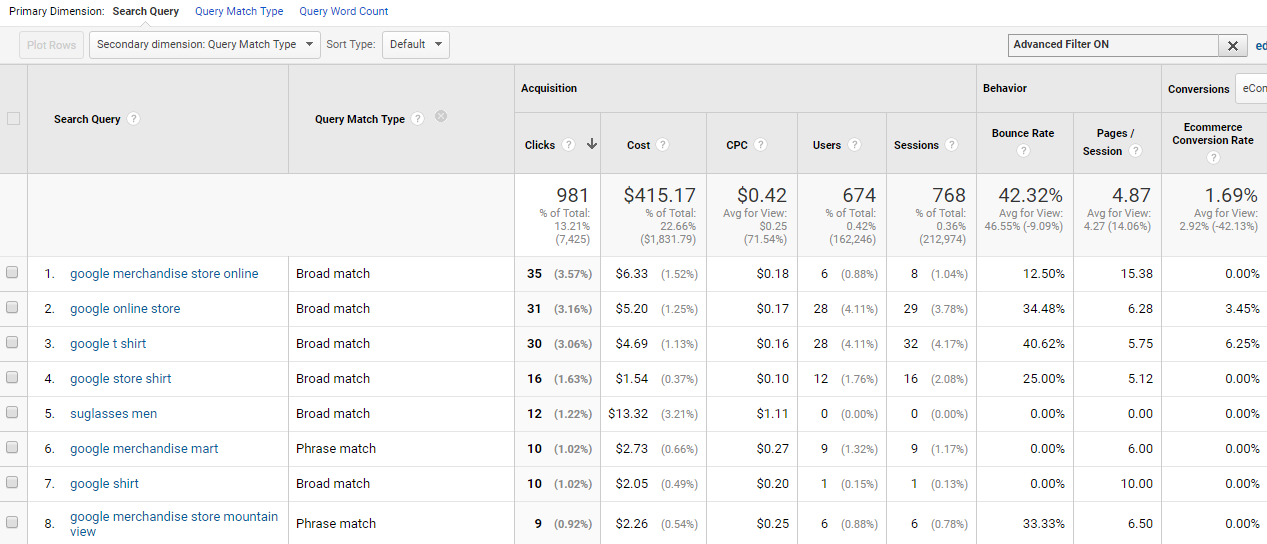
7. Search Queries Report
The Search Queries report belongs to my favourite AdWords reports!
It is very useful as it helps you in two ways:
- To perform in-depth keyword research.
- To find keywords for adding to your negative keywords in one or more AdWords campaigns.
You can find out on which keywords people are searching and arrive on your site. And compare this list to the keywords where you are actually bidding on. This might lead to great opportunities on further optimizing your AdWords campaigns!
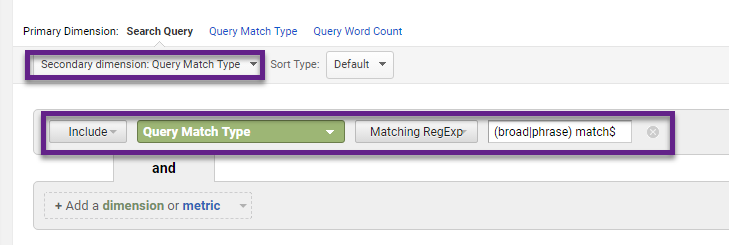
In addition, you can investigate the query match type data and find out if broad and phrase match keywords bring non-converting traffic to your website.
Step 1: set up an advanced table filter (how to use RegEx).
 Step 2: review the Search Queries report.
8. Hour of Day Report
The Hour of Day report is useful in many ways. One of the best ways to leverage, is to adjust your ad schedule (when are your ads visible?) in AdWords.
With one simple tweak you can review the main graph on the Ecom CR% metric:
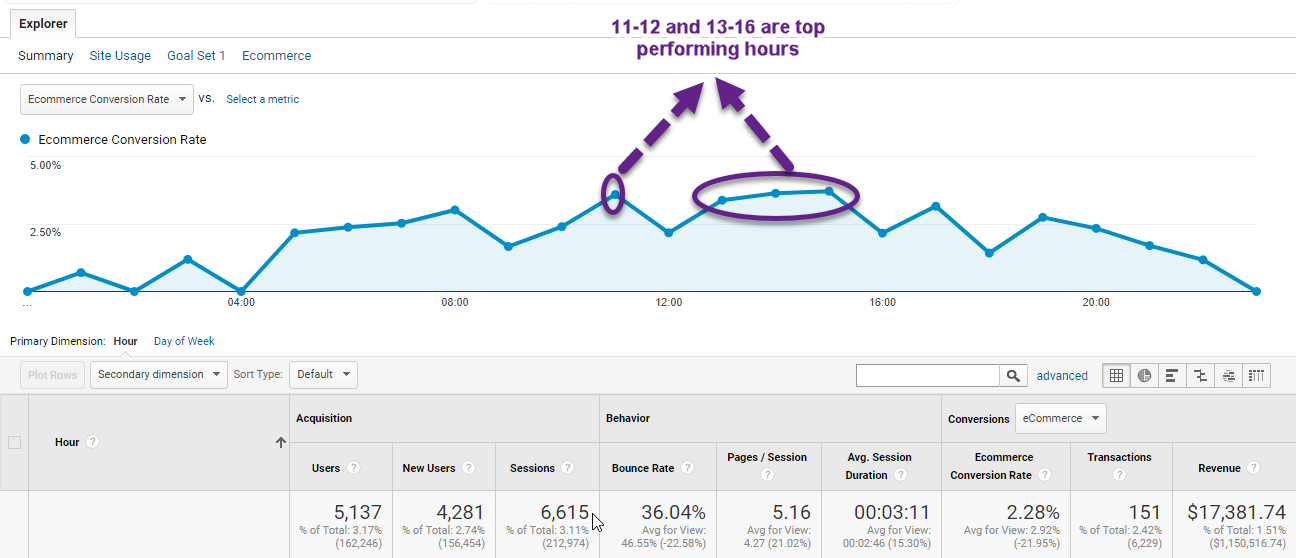
I have written an entire blogpost on analyzing hourly data on your website. Make sure to check it out as well!
I recommend to analyze at least a few weeks of data to get the most accurate and reliable hourly numbers by normalizing the data.
9. Final/Destination URLs Report
The Final or Destination URLs report allows you to analyze the AdWords URLs as defined in AdWords. Further, you can analyze the Ad Distribution Network dimension: Google Search vs. Search Partners.
If desired, you can change the primary dimension to “Keyword” as well.
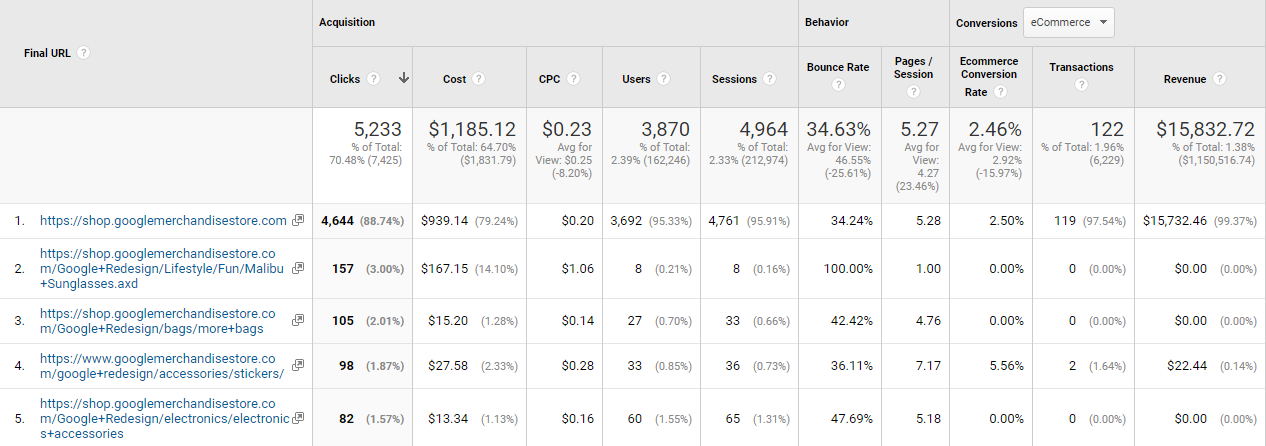
Keep in mind that the Destination URL is not always the same as the Landing Page. A visitor that originally landed on page A and visits your website one week later and lands on page B (after a bookmark) will still be measured under the original Destination URL.
10. Display Targeting Report
The Display Targeting report shows different options on how users can be targeted on the Google Display Network:
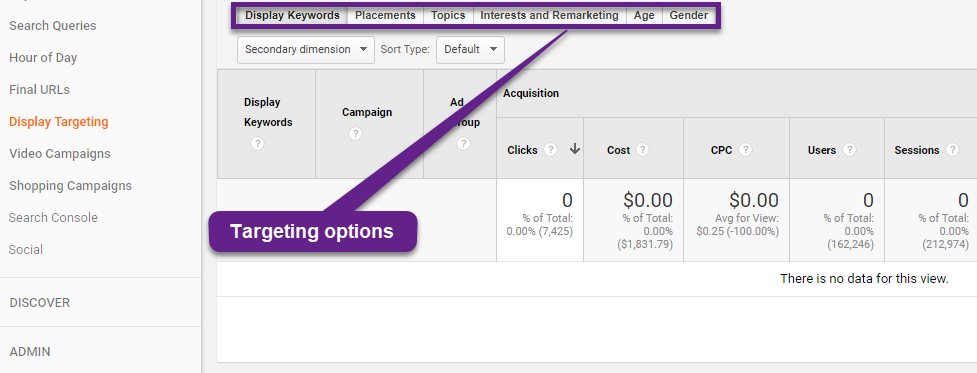
In the Google Demo account there is no data visible here. The most easy way to make this report actionable is by comparing goal or ecommerce conversion rates for different audiences and demographics and then adjusting bids based on the results.
11. Video Campaigns Report
If applicable, the Video Campaigns report provides data on the performance of YouTube ads.
It breaks down special video campaign metrics into website clicks and engagement data.
Click on the question mark next to a metric to learn more specific details about each of the video campaign metrics.
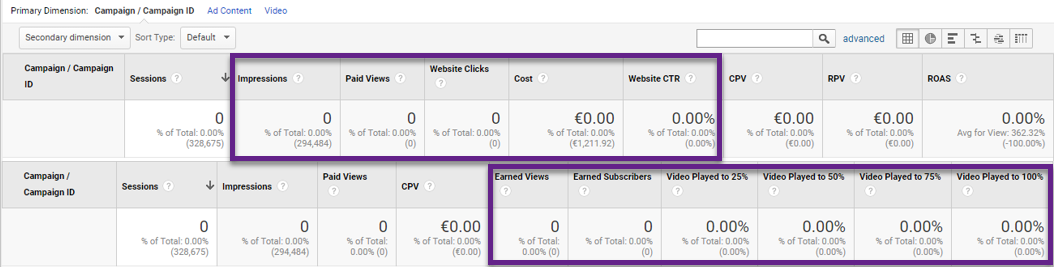
12. Shopping Campaigns Report
Shopping campaigns are connected to Product Listing Ads (PLAs).
Here is an example: You can evaluate your shopping campaigns in Google Analytics on three unique dimensions as shown below:
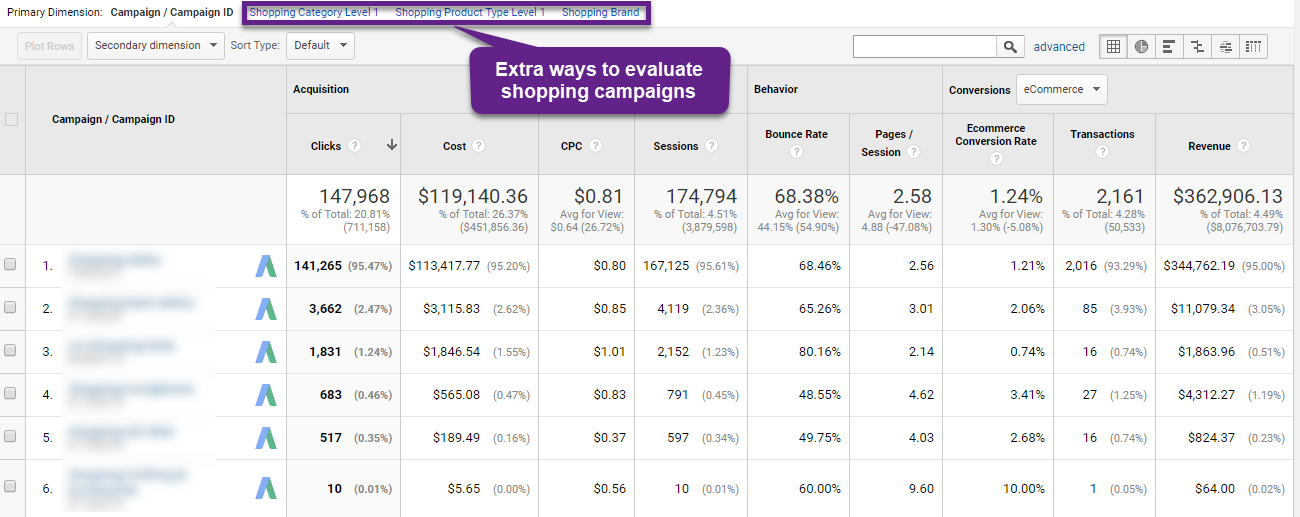 The usefulness of each of the dimensions depends on your shopping campaign hierarchy. E.g. if your company markets just one brand, it wouldn’t make a lot of sense to filter on the dimension “Shopping Brand”.
The Shopping Campaign report is the last standard AdWords report in Google Analytics.
By now you should have a good basic understanding of what AdWords data is available in Google Analytics.
Let’s continue with the more advanced part of AdWords optimization in Analytics!
Advanced AdWords Optimization
In this chapter we will look into advanced examples of how you can use AdWords and Google Analytics together to optimze your AdWords campagins.
1. Non-Converting Keywords Analysis
It’s great to find out whether some non-converting keywords are still driving relevant traffic.
You could set up a segment (to filter out on the session level) or advanced table filter (to filter on the keyword level).
In this example I will focus on the keyword filter (keyword with Ecom CR% = 0%).
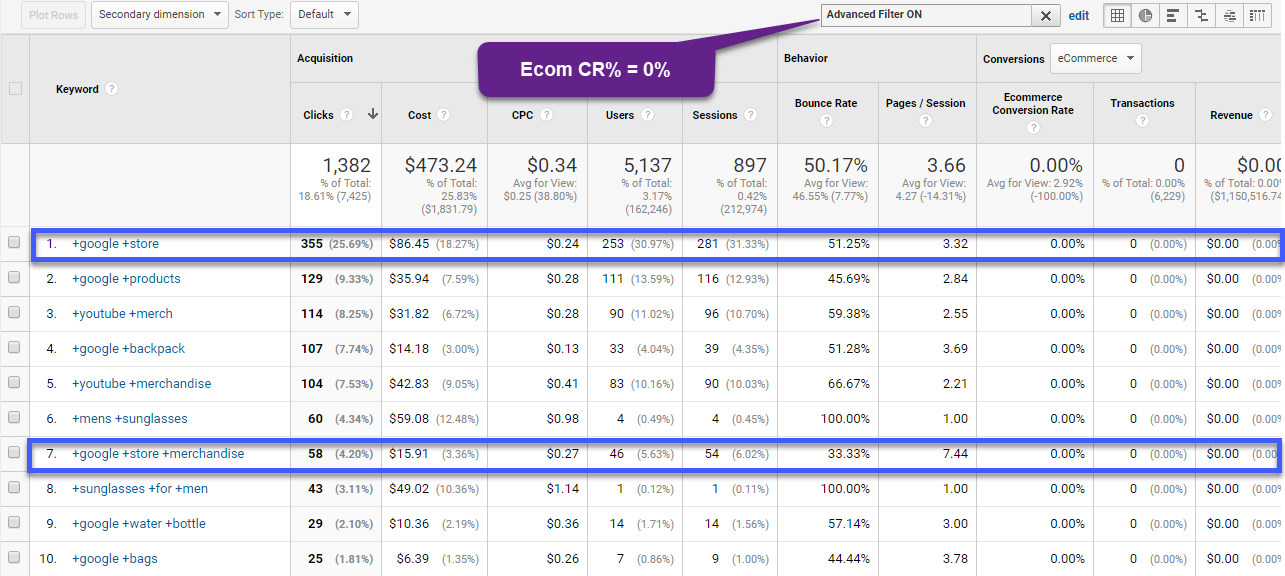 Here you can see that some keywords score above average on engagement metrics, but don’t lead to a conversion.
For example, +google +store +merchandise brings in quite a few new visitors with on average more than 7 pageviews. The numbers are low, so you should analyze this data over a longer period of time.
Usually, you do want to stop bidding on keywords that have a high bounce rate, very low engagement and bad conversion stats. Otherwise you might want to dive deeper to find out ways to improve the overall score of these type of keywords.
2. Device Category Analysis
Segmentation is your key to greater and actionable insights.
Some of your keywords might perform great on one device and very bad on another.
There are different ways on how you can segment on the device level.
Here is a quick example:
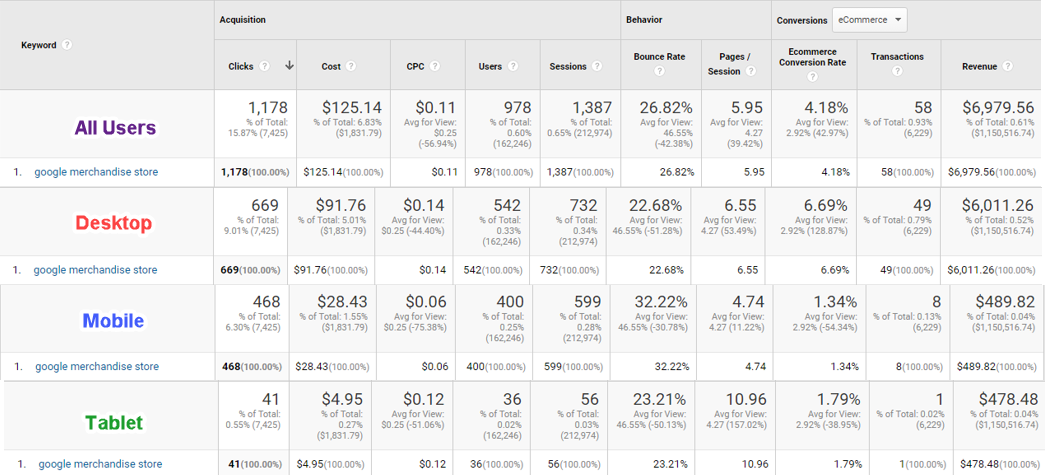
I have used RegEx and the built-in device segmentation to create this screenshot.
Here you can quickly evaluate the performance of your top keywords on the device level. It may reveal some surprising results!
I highly recommend to get this data out of Google Analytics iIf you find yourself running this analysis regularly. I am a huge fan of Supermetrics in combination with Google Sheets.
3. Audience Analysis
The demographic reports allow you to analyze AdWords vs. non-AdWords traffic on the demographical level.
E.g., you could find out whether there are differences on the gender level by adding a secondary dimension “ad slot”.
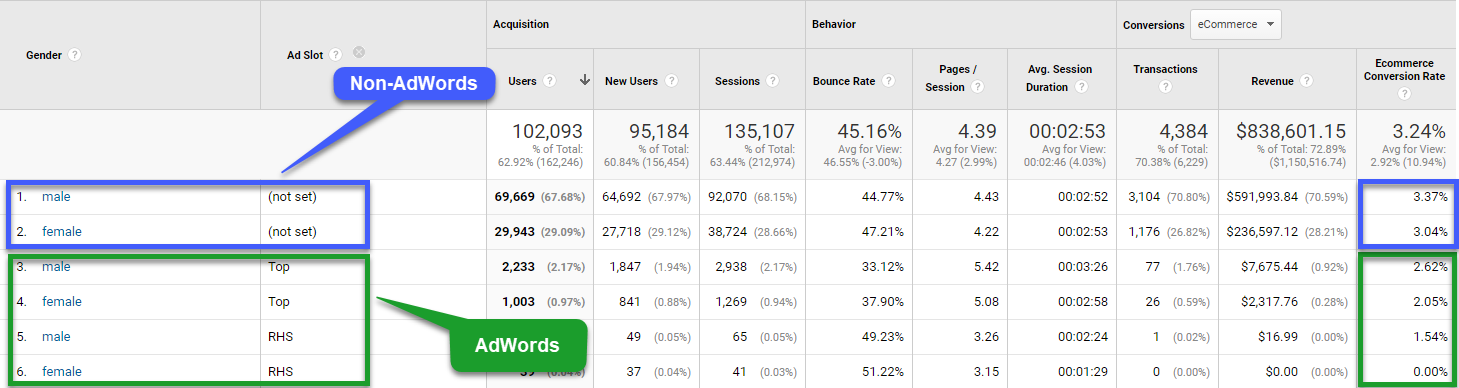 The numbers speak for themselves. You could find out more details – if your traffic numbers per channel are big enough – by segmenting on the source/medium or channel dimension.
4. Mobile AdWords Analysis
Specifically for Mobile, do AdWords visitors perform well on average? Modify the Device Category report to create this table:
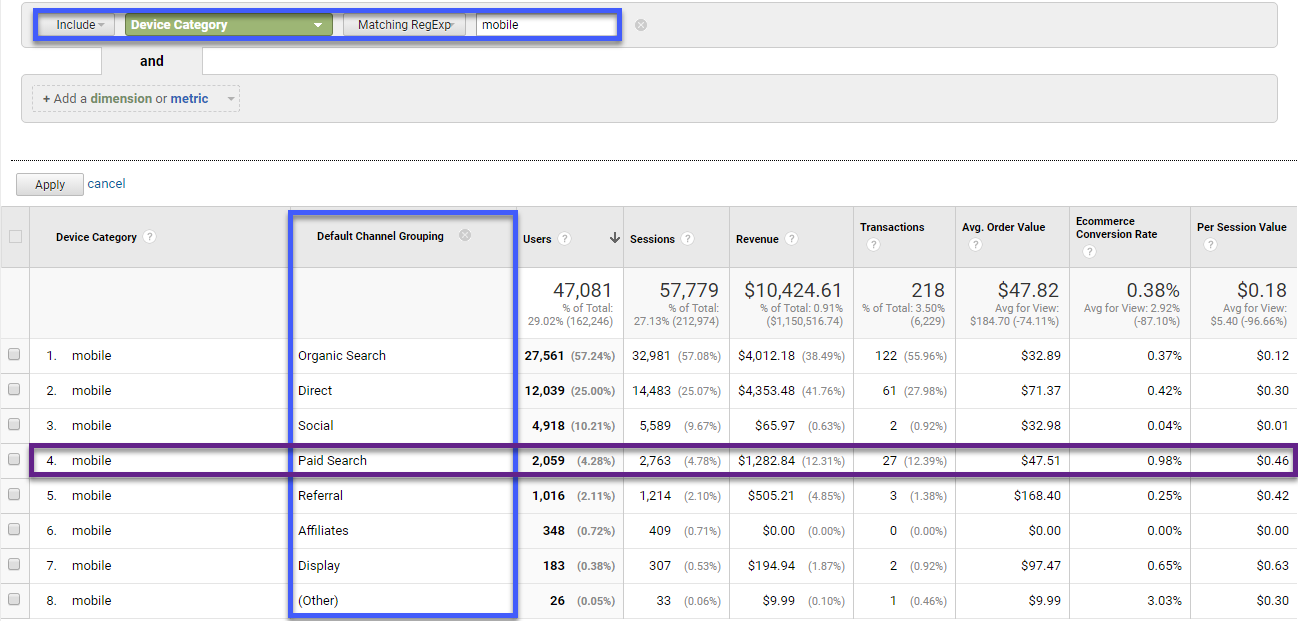 Be sure to define your Default Channel Grouping correctly if you decide to use this report.
5. Multi-Channel Analysis
Find out what role AdWords plays in the user journey towards conversion.
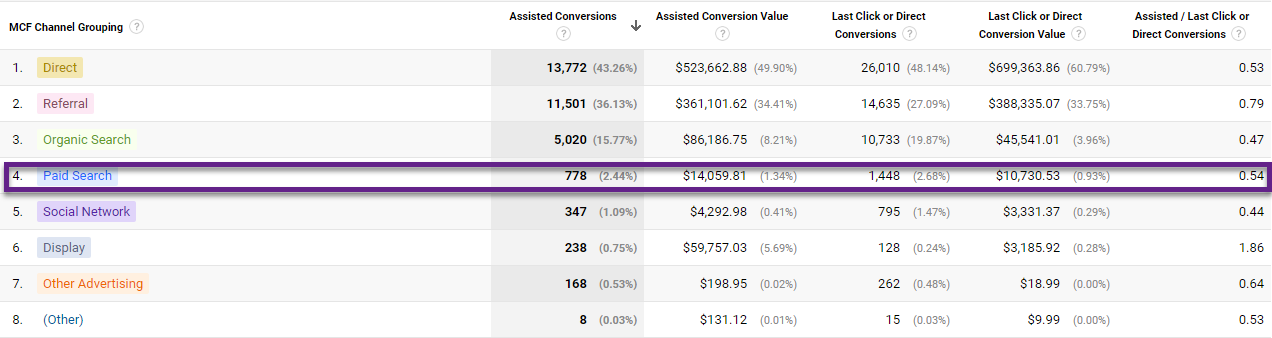
- Assisted Conversions: the number of conversions where AdWords appeared on the conversion path, but was not the last touchpoint before conversion.
- Last Click or Direct Conversions: the number of conversions for which AdWords was the last touchpoint before conversion.
- Assisted Conversions: the closer to zero, the bigger the role in “closing” the conversion. The higher the number, the bigger the role in “assisting” the conversion. Usually Display campaigns have a large number where AdWords (brand) campaigns have a number closer to zero.
For more advanced insights I recommend:
- Defining branded and generic paid search (AdWords) campaigns. Or even analyzing this data at a deeper level if your numbers are high enough.
- Comparing different attribution models via the “Model Comparison Tool”. To be found at: Conversions > Attribution > Model Comparison Tool.
6. Creating Remarketing Lists
Last but not least, the ability to create Remarketing Lists directly in Google Analytics is extremely powerful.
Creating Remarketing Lists can be accomplished in two different ways:
Option 1: via the admin interface.
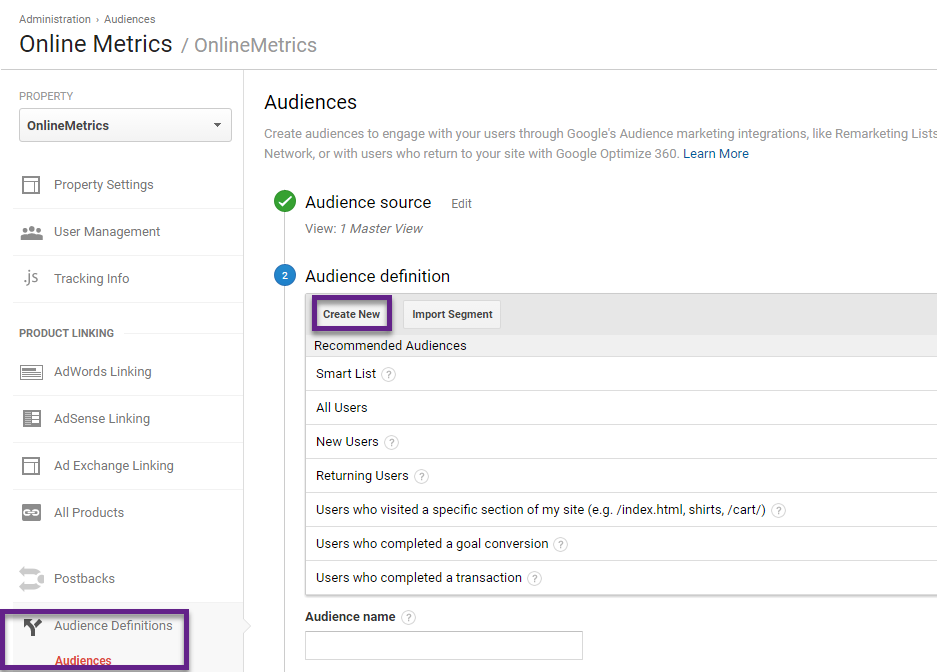
Option 2: via the segment builder in the reporting interface (highly recommended!):
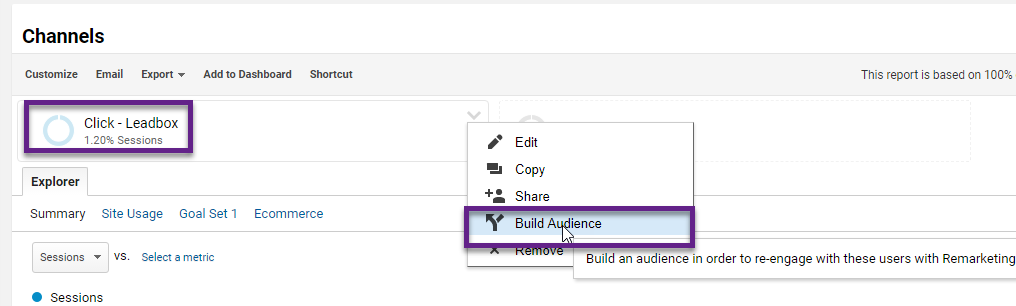
After you click on “Build Audience” you will immediately go to the audience builder: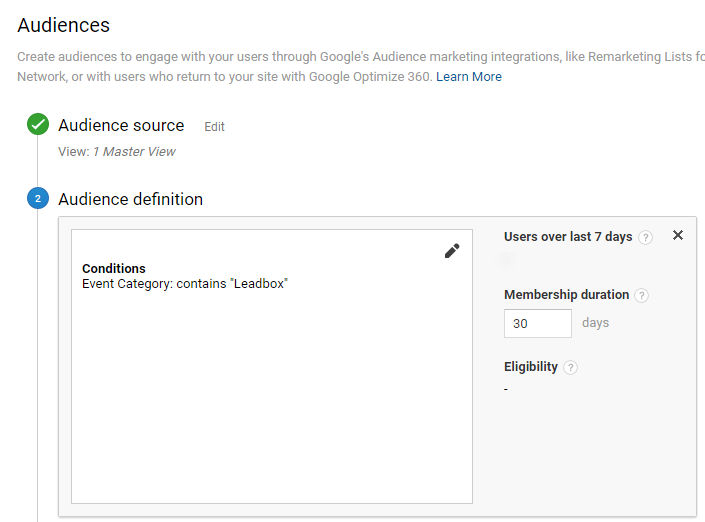
Select a lookback window and the numbers of days a user remains in the audience (between 1 and 540 days). Give the audience a name and you are good to go!
Segments can be applied to all data in Google Analytics which makes your Remarketing Lists extremely powerful. Experiment, learn and optimize!
One last thing, you can leverage the Custom Reports feature to find other creative ways for driving AdWords insights in your unique business.
Here is an article about Custom Reports to learn more about how to create them in a quick way.
And if you have some time left :-), I recommend to check out the common pitfalls of using Custom Reports as well.
Concluding Thoughts
I hope by now you agree that extending your AdWords account insights with the AdWords reports in Google Analytics is extremely valuable.
There are a few last remarks I would like to share:
- As a first step make sure that AdWords is properly linked to Google Analytics. Review the first part of this article to get this done.
- I recommend to create separate views for CPC/AdWords vs. Non-CPC/Non-AdWords traffic. This isolation helps you quicker analyze your AdWords data set in more depth. In addition, you are in control as far as which data to expose to certain people and which not.
- Split your paid search traffic in branded and generic traffic by adding your brand terms in the admin section (at the view level).
- Create Remarketing Lists to persuade your potential customers who didn’t convert the first time to convert later.
- Spend your AdWords budget wisely; find out what the most profitable hours are and target your visitors accordingly.
- Use Custom Reports to structure your reports in a way that you best understand your audience.
- There are no limitations in what insights you can get through Analytics. Define your main business questions upfront and find the answers in your data.
This is it! I hope the AdWords reports, analysis and optimization techniques will help you to grow your business. And as always, I appreciate a share or comment.
One last thing... Make sure to get my extensive checklist for your Google Analytics setup. It contains 50+ crucial things to take into account when setting up Google Analytics.Download My Google Analytics Setup Cheat Sheet
The post The Definitive Guide to Optimizing AdWords with Google Analytics appeared first on Online Metrics.