One of the most underused data sources in Google Analytics is demographics data. You will learn my best strategies for turning these demographic reports into actionable insights.
There are a ton of ways in analyzing your Google Analytics data set. If you are a long time reader, you know how much I love segmentation in Google Analytics.
Segmentation is your pathway to actionable insights. This is one of the crucial principles of web analytics that everybody should understand.
One of the powerful ways to learn more about your visitors and customers, is by applying demographic segmentation rules.
In the rest of this article I will share all I have learned about analyzing and using demographic data in Google Analytics.
Tip 1: Know How The Data is Collected
As with any other dataset, you should know how demographic data in Google Analytics is collected.
This is where Analytics gets the data:
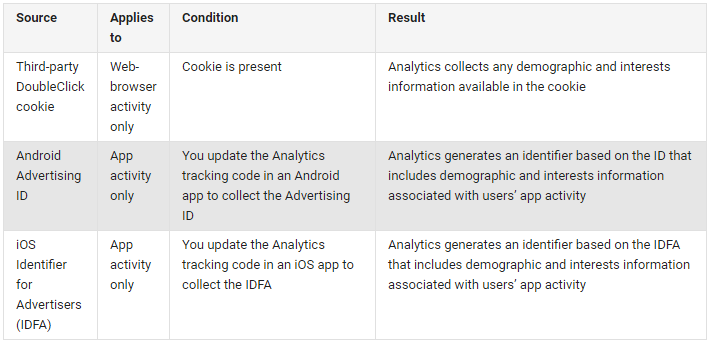 You need to understand that this data is not available for every single user, so usually the reports will be based on a subset of users that visit your website.
In addition, some data in the reports may be removed when thresholds are applied to prevent inferring the identity of an individual user.
However, despite all drawbacks I have found these reports extremely useful in guiding some of your marketing efforts.
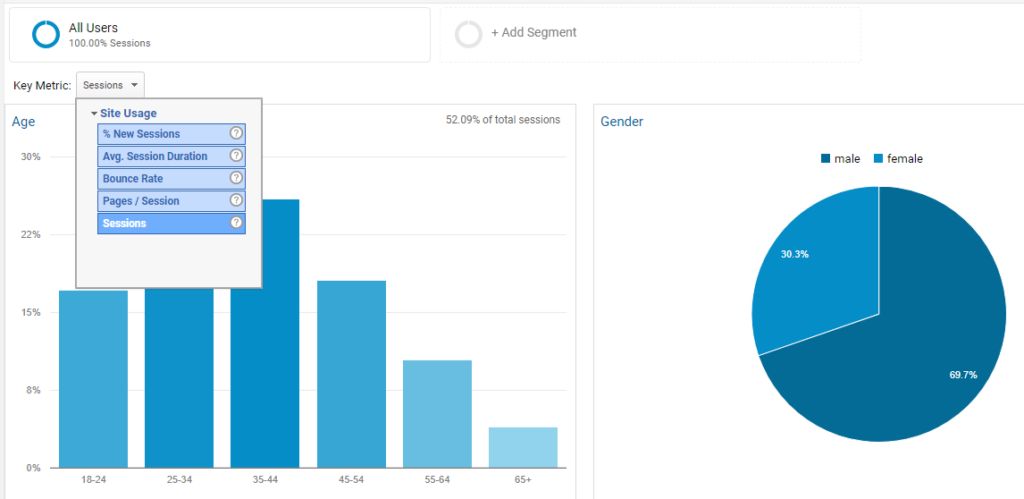
Tip 2: Don’t Use Small Data Sets
Refrain from selecting one week of data to base your decisions on. In that way you set your business up for disaster. :-)
Here is an example of a large Ecommerce website: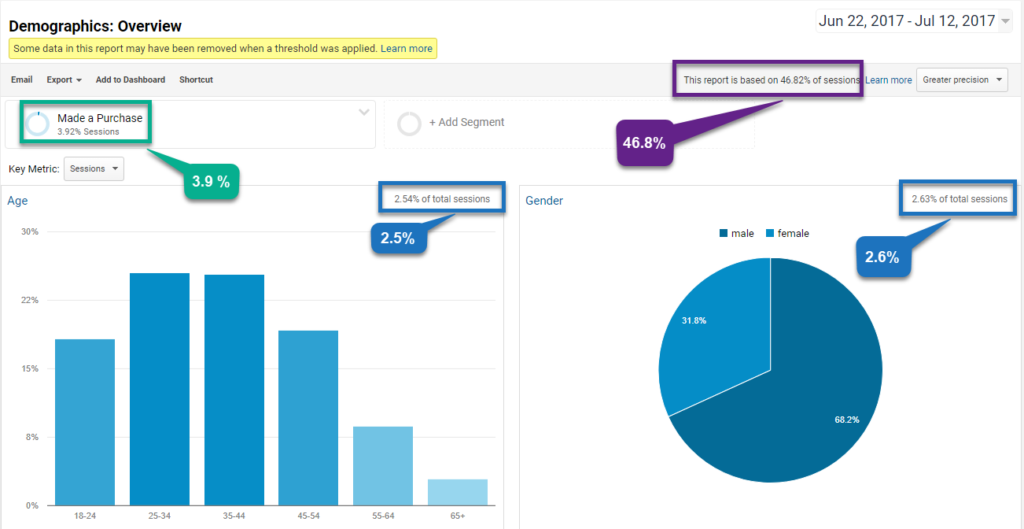
Three weeks of data, a “made a purchase” segment and huge levels of sampling and thresholds are applied.
Make sure you know at what data you are looking at before taking any actions.
I prefer to analyze data of roughly a three months period and avoid sampling whenever possible.
Tip 3: Start with Unsegmented Reports
It’s definitely worth it to look into the basic, overall reports before you start doing fancy stuff.
These reports (Q2 2017) are derived from the Google Analytics Demo Account:
Report 1: Demographic Reports – Overview
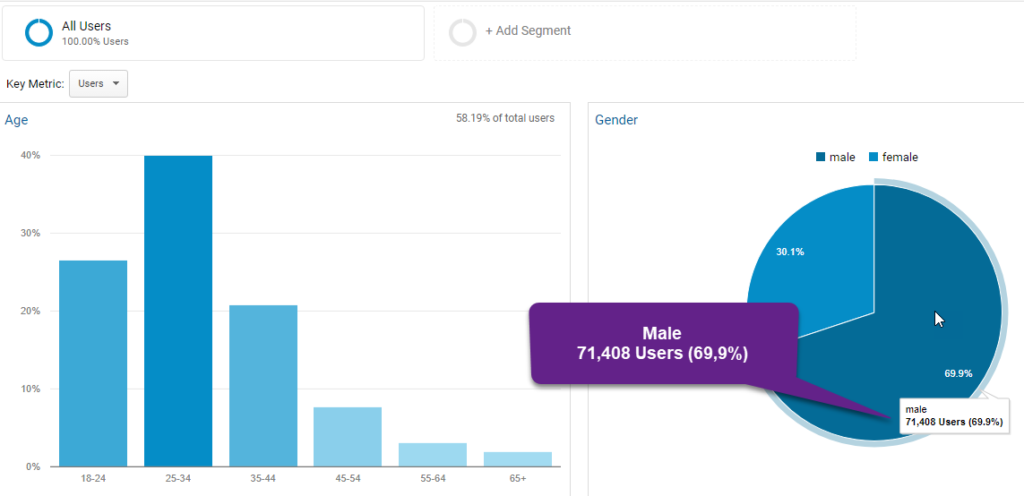
Without doubt, male visitors are dominant as a user group for this website.
Further, the data shows that the website is mainly visited by people in the age group 18 to 34.
Due to the small percentages, we can’t say a lot about the 55+ age groups in isolation.
Report 2: Demographic Reports – Age
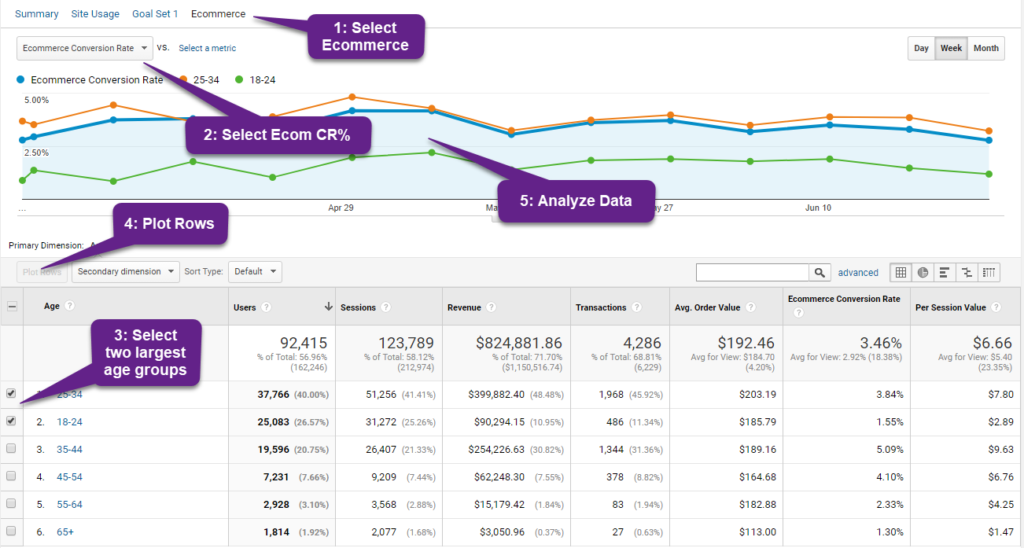 This is another report which can already reveal a ton of insights. By focusing my analysis on the two largest groups and the Ecom CR%, I can learn a lot about my main audiences.
It’s clear that the 25 to 34 age group is outperforming the youngsters week after week. They have the largest impact on the overall Ecom CR% of this site.
Report 3: Demographic Reports – Gender
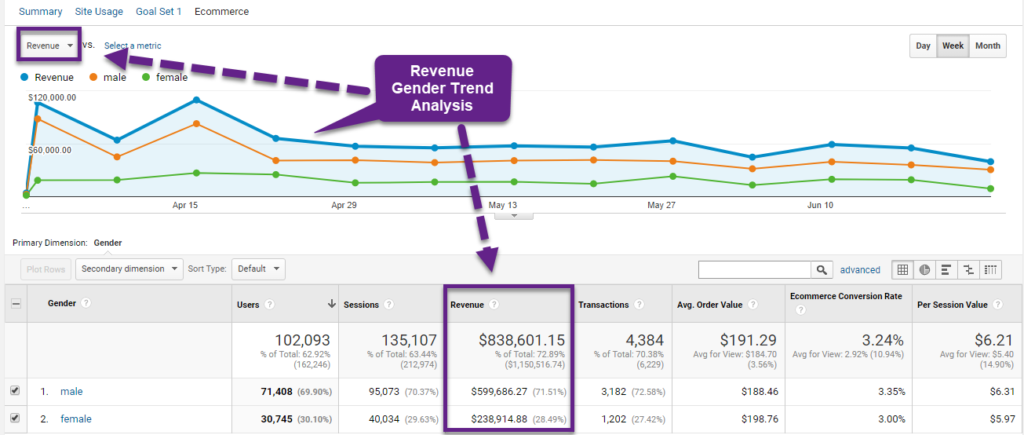 The report above shows how men are behaving compared to women.
In terms of Ecom Revenue, men are continuously outperforming women. The Ecom CR% is slightly higher, but the huge differences come from more men visiting the site.
These were just a few quick examples in getting up to speed with the demographics reports.
Tip 4: Apply as Secondary Dimensions
Read these posts first if you are rather new to the concept of metrics and dimensions:
- How to Boost Your Data Insights with Secondary Dimensions
- 10 Actionable Tips to Master Metrics and Dimensions in Google Analytics
- 7 Unique Ways to Leverage Google Analytics Dimensions
Here we go:
Although I prefer creating pivot tables in Google Sheets, for the sake of this example I have created one in Google Analytics.
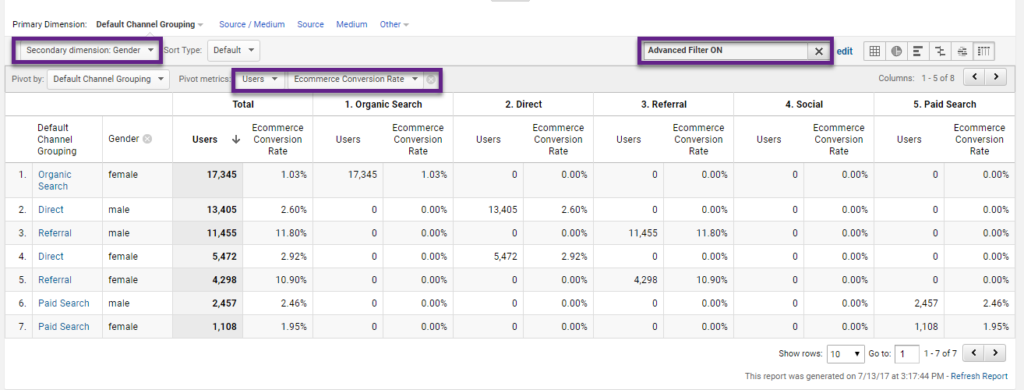
I’ve taken the following steps:
- Navigate to default channel report.
- Apply “Gender” as a secondary dimension.
- Select “Users” and “Ecom CR%” as pivot metrics.
- Apply two advanced table filters:
- Ecom CR% > 1%.
- Users > 1000.
The result is an overview of the most important traffic channels by gender correlated to acquistion (# users) and conversion (Ecom CR%).
This helps to find out whether there is a correlation between gender CR% and my main traffic drivers.
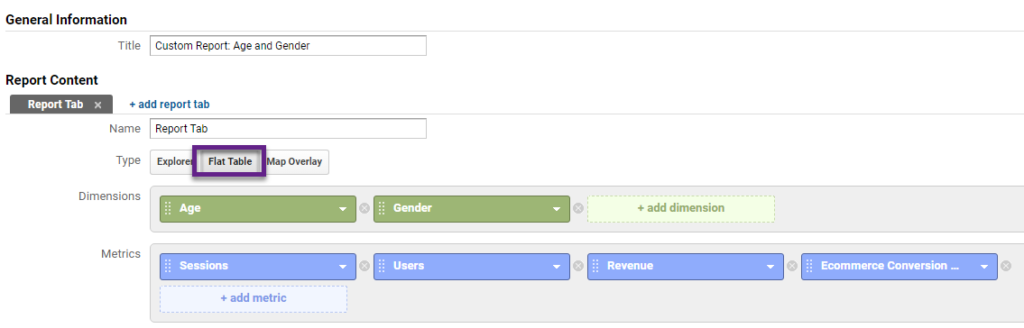
Tip 5: Create Custom Reports
Every business is unique and that’s why you can’t peform optimally without creating custom demographic reports in and outside of Google Analytics.
In less than 2 minutes I have unlocked great insights for segments and audiences:
 Feel free to explore this report in your Google Analytics account. You can copy the settings from below:
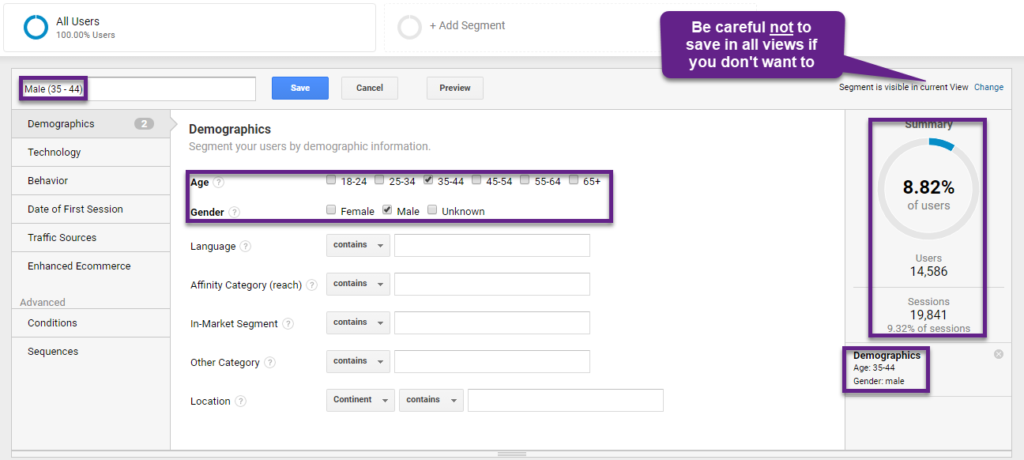
Tip 6: Build Smart Segments
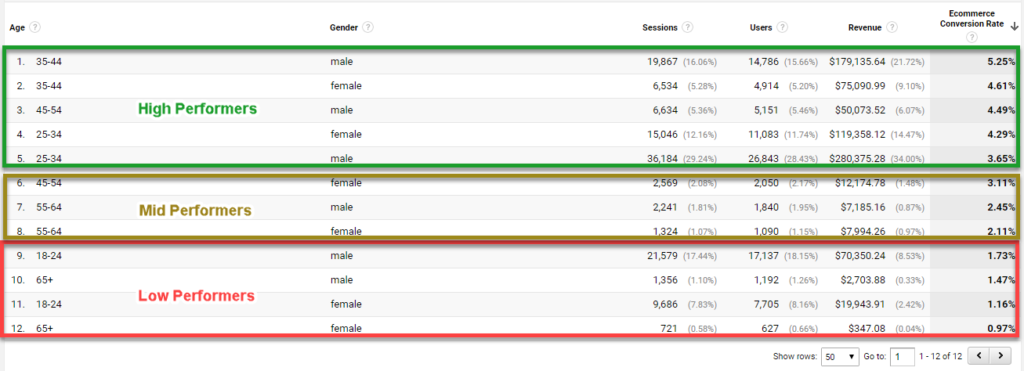
It seems that in my example, the segment 35 – 44 and male, is top performing.
What if I would want to learn more? Let’s build a segment!
 Once ready, apply it to the “device report” next to all users:
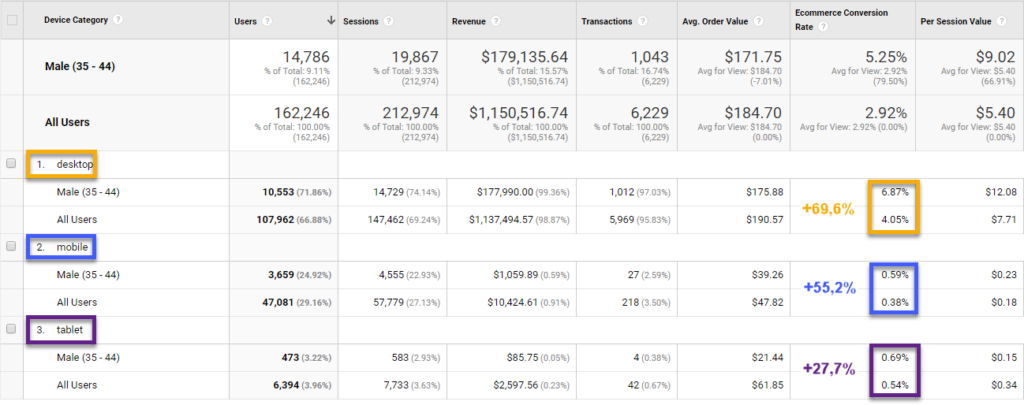 Quick conclusion:
- This segment performs both absolutely and relatively the best on desktop.
Segments are so powerful, don’t you agree?
Five ways to effectively use your demographics data set:
- Understand gender and age composition.
- Target high-value users.
- Eliminate ad spend on low performers.
- Segment reports along business lines.
- Refine marketing audiences.
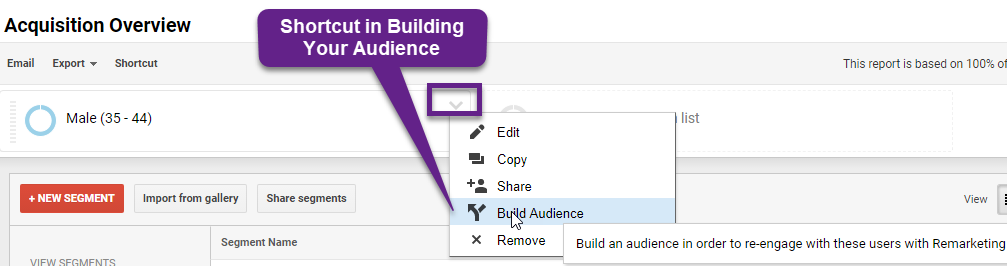
Tip 7: Build Smart Audiences
Since the data mentioned above is also available on Google Analytics’ Remarketing feature, you will be able to use the insights presented when creating your lists.
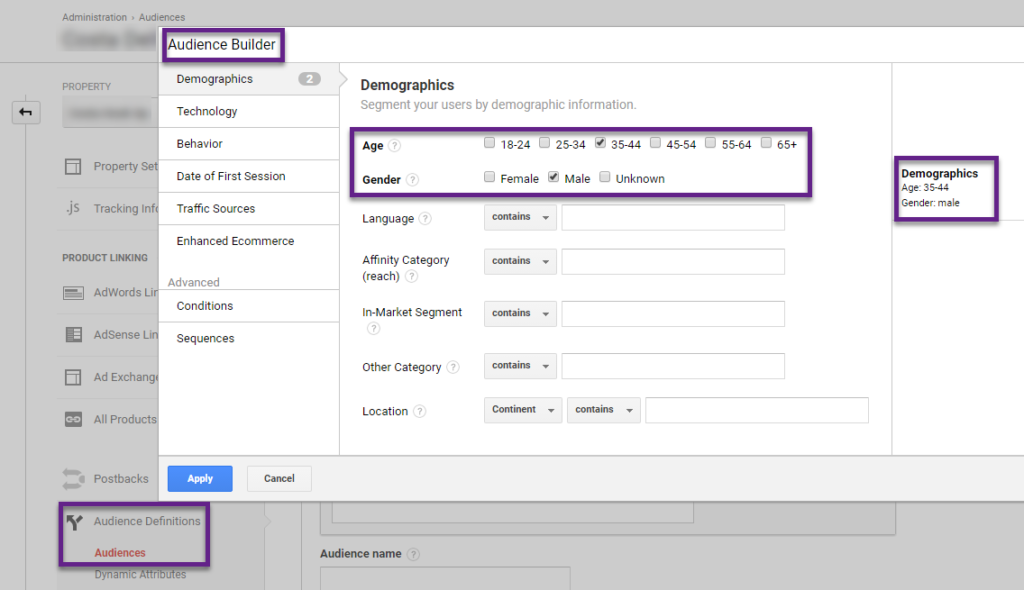 If you are like me and want to get things done quickly, you build them directly from the already created segment:
Tip 8: Better Analyze Your A/B Tests
The quality and impact of your A/B tests depends on two things:
- The time and effort you put into developing your A/B tests.
- The analysis you do after running your A/B tests.
Two common ways to connect your A/B test solution to Google Analytics, is by capturing test data in events or custom dimensions.
Here is a quick example on how to correlate events to gender data:
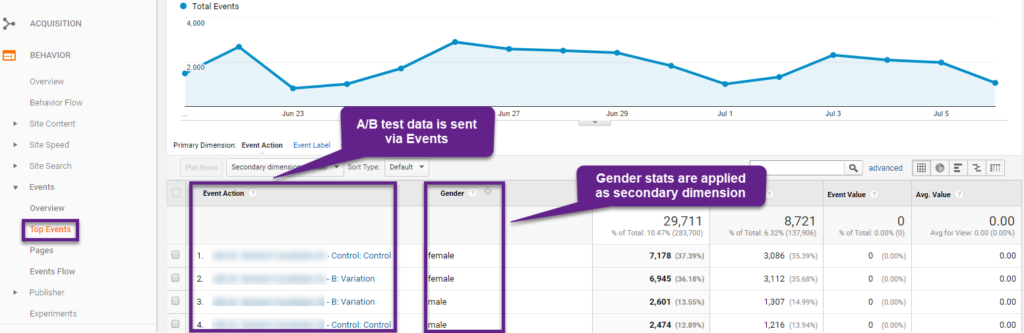
Read this post on how to analyze A/B tests in Google Analytics if you want to learn more about this.
Tip 9: Explore Your Data Outside of GA
Google Analytics is a great start, but anybody with experience in data analysis agrees that external tools and data visualization are key to get from good to great.
Let’s start with using external tools and why.
I love to combine Google Sheets and Supermetrics while performing in-depth data analysis.
Supermetrics enables me to flawlessly extract all data that I need from GA.
In Google Sheets I can build beautiful visualizations or simply use it to store my data before connecting it to Google Data Studio. Which I will explain about in a minute.
Here is an example: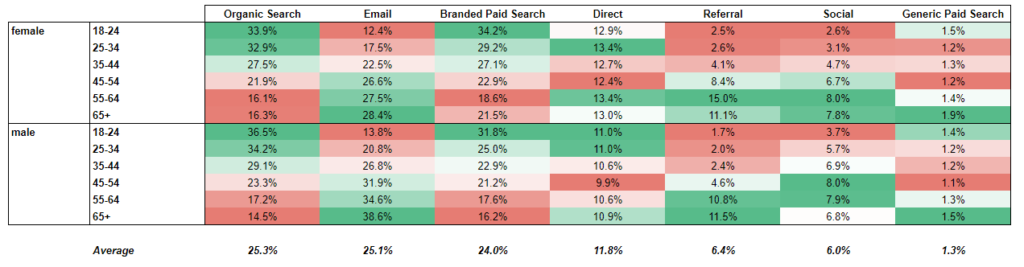 This visualization shows how gender/age segments are correlated to sessions in each of the traffic channels.
The beauty of Supermetrics is that you can – if needed – use a special feature to avoid sampling. I have thoroughly tested it and it brings up very accurate results!
Tip 10: Visualize Demographic Reports
With the introduction of Google Data Studio, no one should ever send a ton of GA screenshots to their clients anymore.
Building visualizations in Google Data Studio is something you should learn! There is no better way to get your point across then by using powerful visualizations as part of your data story.
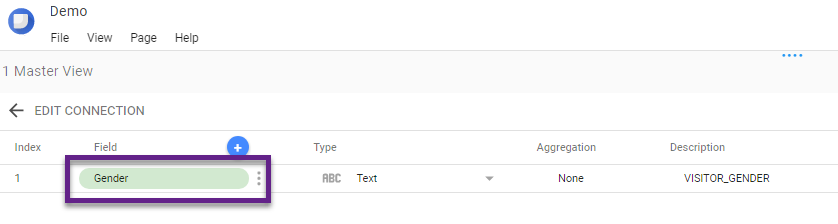
And I have great news for you; you can incorporate demographic data or rules via data sources, segments and filters.
Option 1: Demographics – Data Source Connector
Option 2: Demographics – Segments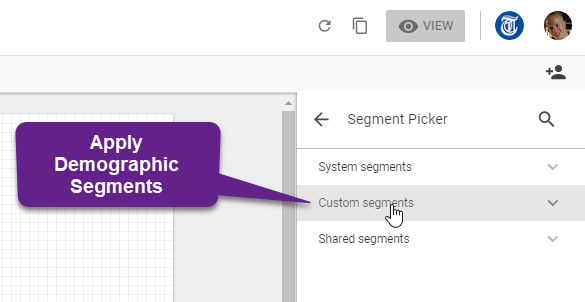 Option 3: Demographics – Filters
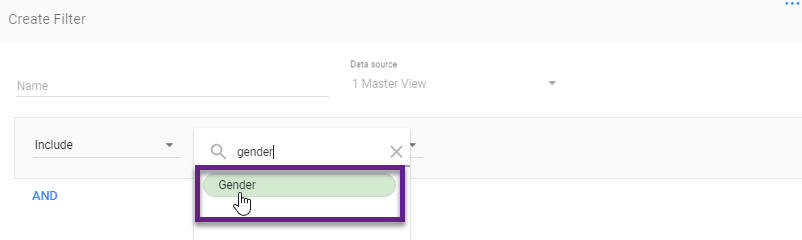 This is my last tip for better leveraging your demographic reports and data in Google Analytics. I hope you have learned a ton of cool, new things!
As always I am happy to hear about your thoughts and experiences. Please share your comments below.
One last thing... Make sure to get my extensive checklist for your Google Analytics setup. It contains 50+ crucial things to take into account when setting up Google Analytics.Download My Google Analytics Setup Cheat Sheet
The post Top 10 Tips to Get Insights from the Google Analytics Demographic Reports appeared first on Online Metrics.